UK vacancies collapsed during the Covid-19 crisis. Recent data suggest that they may be back on the rise, if only to levels seen in the 2008-11 recession. But while this trend is welcome, it is unusual that vacancies are now rising alongside growing unemployment.
With the latest labour market data confirming the continued increase in UK unemployment, one important factor that will help to mitigate this trend is rising vacancies. After all, employment support schemes are no use if there are no jobs for the unemployed to occupy. So the parallel announcement that vacancies are rising again is potentially good news. As ever though, context is crucial.
The UK economy is now around 10% larger (in terms of population) than in the previous recession of 2008-11. But, as with redundancies, the Office for National Statistics seems reluctant to account for changes in the size of the workforce over time when making comparisons. If we do this, then the perception of where we are is changed somewhat.
A bigger economy means more vacancies. We don’t compare the number of vacancies in London and Exeter for the simple reason that the populations of these cities are very different. So why do the same with comparisons over time if the populations are different? If policy-makers do not take account of population change, they might mistakenly see the situation as more benign than it actually is.
The UK has a longstanding issue with measuring vacancies. Back in the bad old days, vacancies were compiled and advertised at job centres. Not all vacancies had to be notified and when notification was made compulsory (briefly in the 2010s following a recommendation from the Migration Advisory Committee), many firms complained about the perceived extra administrative burden. The job centre vacancy data were quietly shelved following a botched recoding exercise that left the occupations recorded impossible to compare over time.
The current method of counting vacancies is the Vacancy Survey, which includes around 6,000 employers each quarter. The downsides to this source are its small sample size, which limits detailed sector analysis, and the fact that there is no information on the occupations of the vacancies advertised. What’s more, the survey only began in 2001, which means that it is not possible to compare vacancy patterns to those in recessions before 2008-11.
Notwithstanding these analytical challenges, Figure 1 illustrates the pattern of vacancies (orange line) since 2001 alongside the vacancy rate (blue line). The vacancy rate represents vacancies as a proportion of the labour force, so it clearly takes account of population changes over time.
Figure 1: Vacancy rate and level, 2001-2020
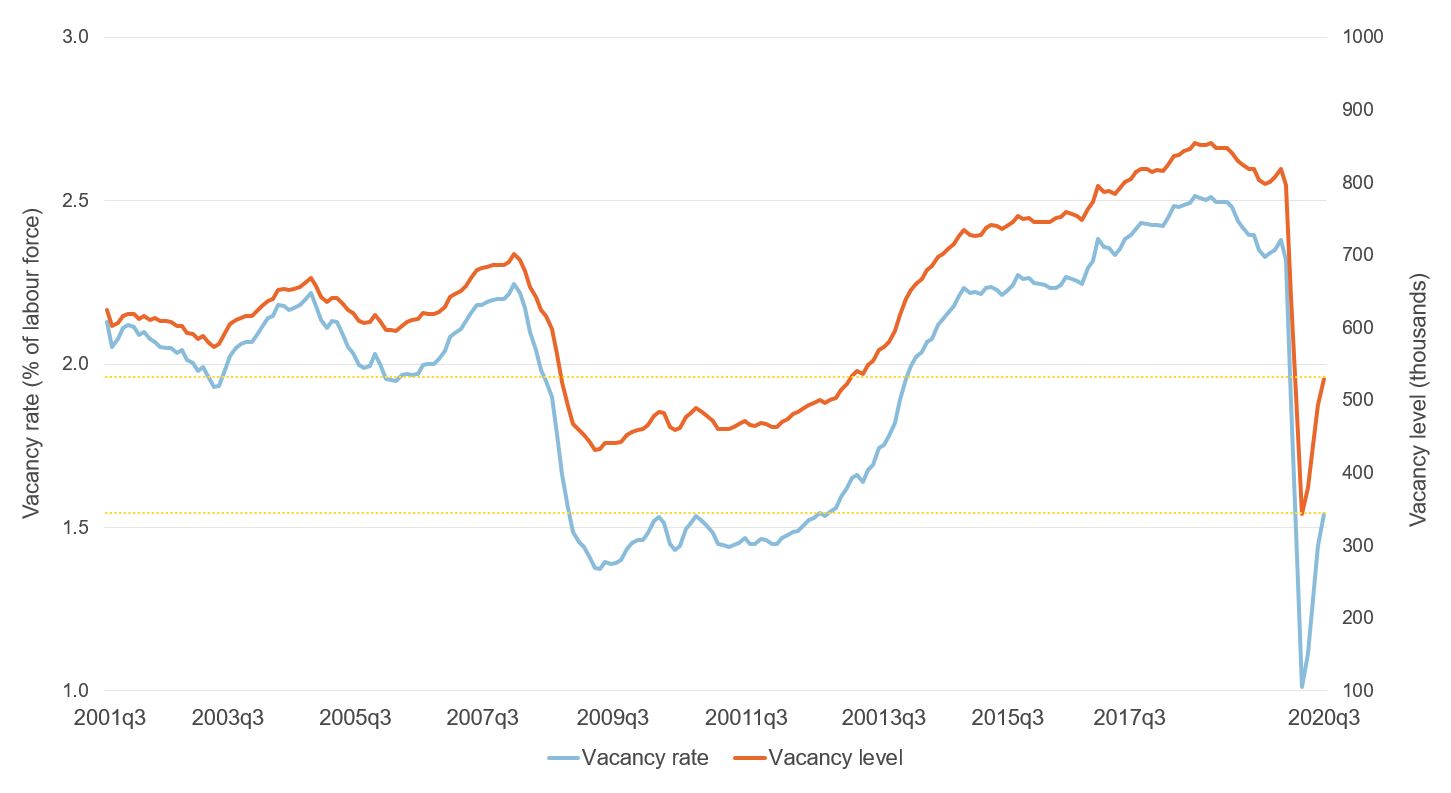
Data sources: Author’s calculations using Vacancy Survey estimates of vacancies and Labour Force Survey (LFS) estimates of the labour force.
There are several things to take away from the chart. First, if population change is ignored, the collapse in vacancies under Covid-19 – while bad – is not nearly as bad as when population change is taken into account. Things were much worse during the first nine months of the year than in the previous downturn. Similarly, the peak-to-peak vacancy comparison from 2007 to 2018 is exaggerated by just comparing vacancy levels.
This means that the recent recovery in vacancies is also flattered by failing to account for population change. The dotted lines on the chart equate the current levels of vacancies to a point in the past that registered the same number. On this basis, vacancy levels are now back to where they were in the third quarter of 2013. Using vacancy rates, the UK is only back to the levels of the second quarter of 2012 or even the second quarter of 2010.
The reason why a sustained rise in vacancy rates is important is that the unemployed always have to compete with employed jobseekers for new roles. This is part of what makes getting out of unemployment so challenging. During the previous downturn, vacancy rates were rising for over a year before unemployment started to decline on a sustained basis.
The unusual feature of the Covid-19 recession is that unemployment is rising alongside rising vacancy rates. As Figure 2 confirms, this does not normally happen. But then this is no normal downturn. The furlough scheme kept people in jobs while at the same time employers paused hiring and vacancies plummeted.
Figure 2: Vacancy rate and unemployment rate, 2001-2020

Data sources: Author’s calculations using Vacancy Survey estimates of vacancies and LFS estimates of labour force.
But now the resumption of some hiring coincides with the undoing of the first furlough scheme in September and October (subsequently abandoned and relaunched) and the resumption of layoffs. That unemployment and vacancies are now rising at the same time suggests that the unemployed are not getting to these new openings.
Economists talk about ‘mismatch’ when looking at how many unemployed are associated with a given number of vacancies – but this looks like ‘mismatch extra max’. It is certainly something that policy-makers should watch closely over the coming months.


