Large shocks like the global financial crisis of 2007-09 have reshaped the UK’s financial services industry. Using network theory, researchers can monitor change in real time, exploring how different risks can be transmitted throughout the nation’s financial system.
Researchers, regulators and private-sector analysts are increasingly looking for ways to monitor financial systems in as close to real time as they can. While the UK financial system is more resilient than it was in 2007/08, when it was shaken by the global financial crisis, new vulnerabilities are emerging that are difficult to track. This makes accurate monitoring as important as ever.
There are several problems in tracing risk. Existing regulation still focuses on banks, even though asset managers and insurers are playing an increasingly central role in the sector. Large funds can amplify shocks through fire sales (the sale of shares at very low prices), while insurers’ opaque exposures may not be fully covered by existing rules.
The problems for regulators in modelling and monitoring risk do not stop there. Mounting geopolitical tensions bring additional uncertainty. For example, changes in US trade policy, energy-related conflicts, and global financial fragmentation could each redraw linkages between financial institutions in ways that current models cannot capture easily. Tools such as traditional balance sheet analysis can give a detailed picture of individual institutions but struggle to capture how risks ripple through the system from one organisation to another.
All these issues underscore the need for new ways by which regulators can monitor emerging risks in the UK financial system, with data collection methods that are sufficiently frequent to allow them to respond in a timely way. New risks require new monitoring approaches.
Network analysis in the financial sector
In this context, Fathom Consulting, commissioned by the Financial Conduct Authority, has developed a new way of monitoring systemic risk. The Fathom team turned to network theory: a branch of mathematics that has in the past been used to map connections – both between people in a social network and between firms. This approach is used to create new tools to explore how risk spreads through the financial system.
Two complementary tools are used: minimum spanning trees (MSTs), diagrams that show the shortest path through a network, revealing which firms or sectors are most closely linked to each other; and directed maps (or ‘DNGs’) that identify causality, showing who transmits risk and who receives it.
How did the system look before and after the global financial crisis?
In the years before 2008, the UK financial network was tightly clustered (see Figure 1). Asset managers and banks sat at its core, while failed institutions such as Northern Rock and HBOS were closely tied both to each other and to the real estate sector (these entities are highlighted by the red ring).
In this context, the MST reveals that property-related shocks could travel quickly across the network. It also shows that the banks involved were relatively tightly clustered themselves and were some distance from the rest of the UK financial system. This explained why government intervention was able to restrict contagion to a relatively small number of banks, albeit at a high cost. Directed network graphs confirm that banks were major transmitters of risk. This helps explain why the collapse of a handful of lenders had such wide-reaching effects.
After the crisis the picture changed. The post-crisis MST (the righthand panel in Figure 1) shows that banks became more dispersed, and asset managers occupied a more central role. In this context, the DNGs show that regulatory reforms, particularly higher capital requirements, reduced interconnectedness – the total connectedness index fell by almost 20%. The real economy (the production, purchase and flow of goods and services outside finance) also became more insulated from financial shocks. Risk transmission did not vanish, but it shifted towards asset managers and insurers, reflecting new patterns of vulnerability.
Figure 1: MSTs of UK financial services pre- and post-crisis
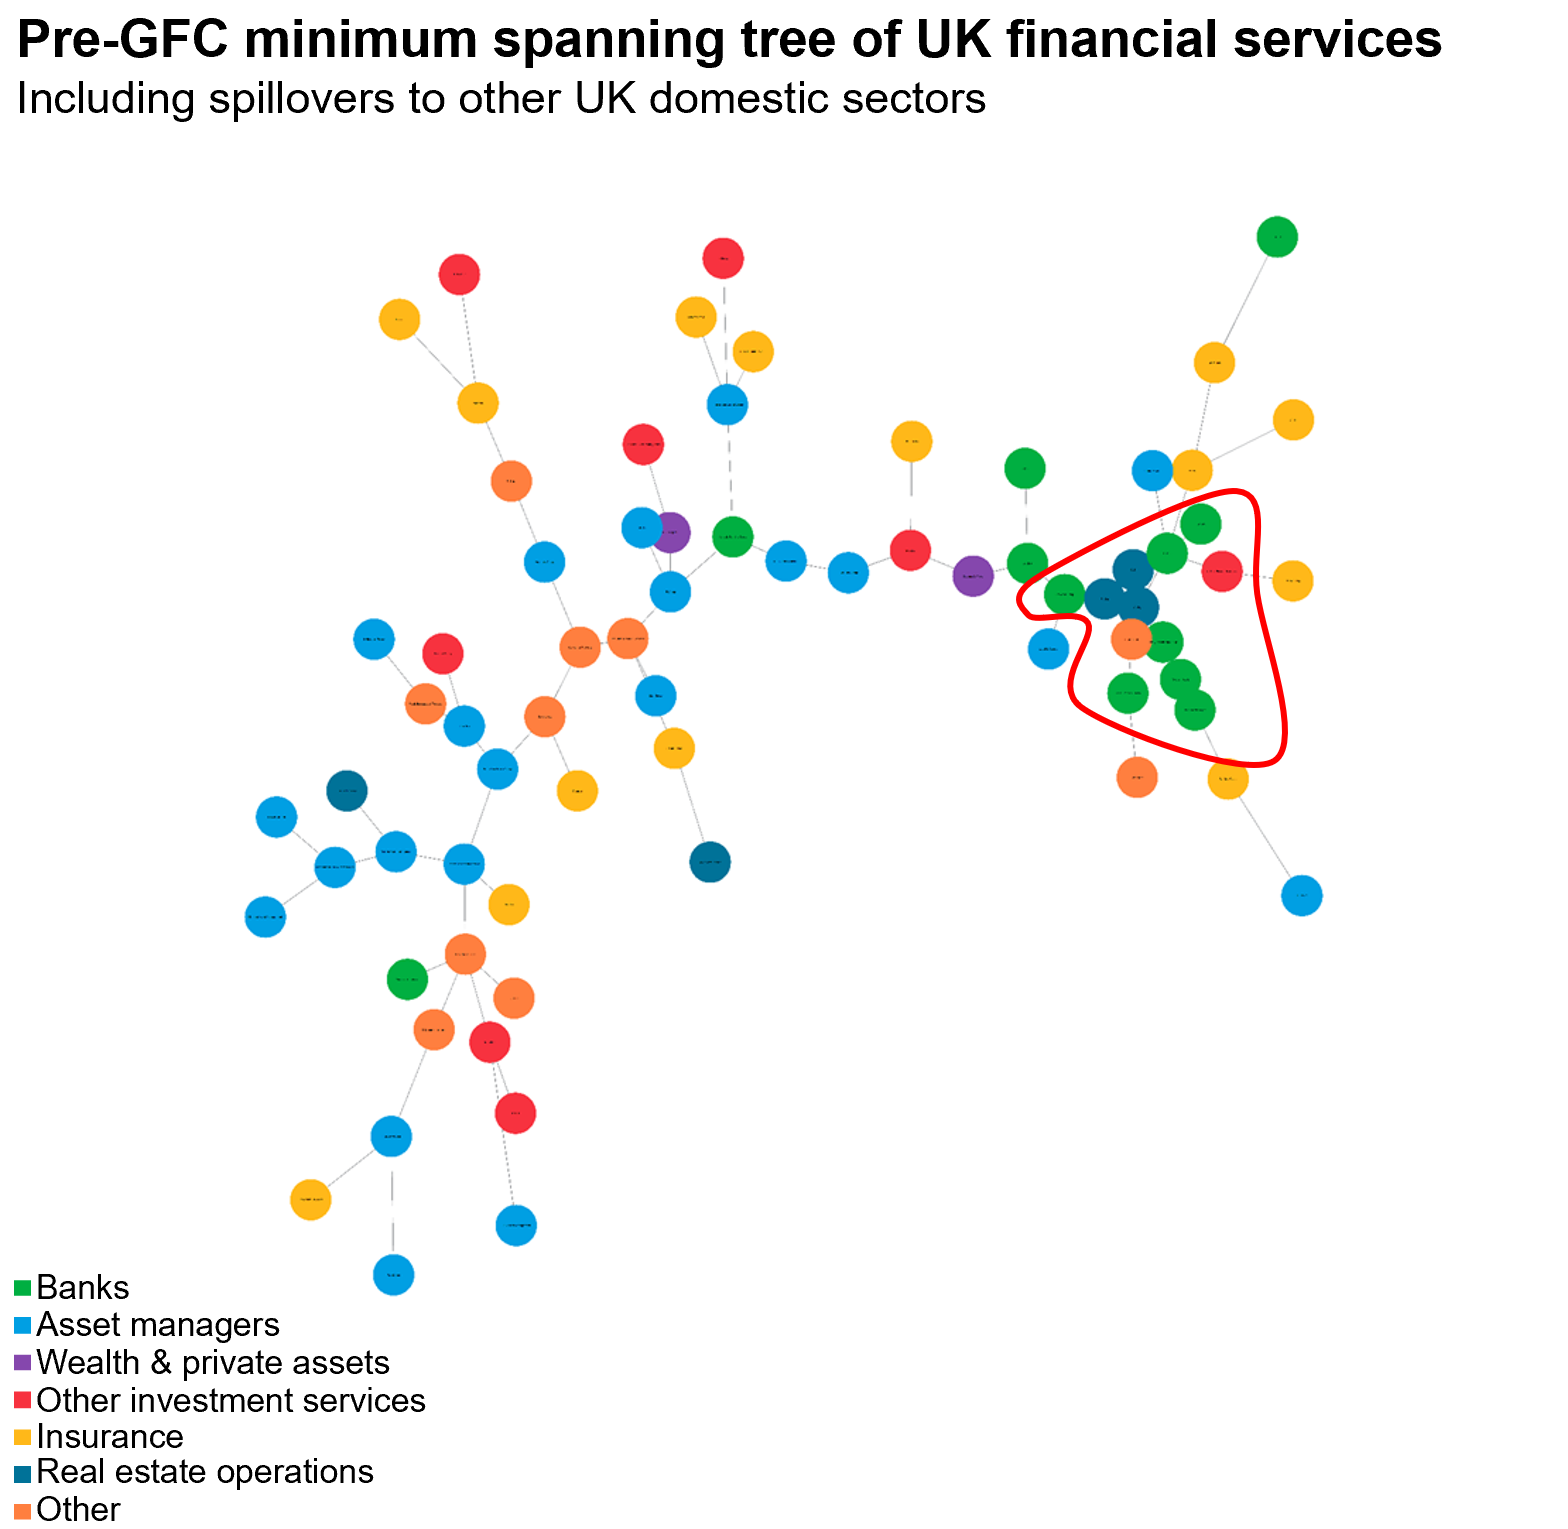
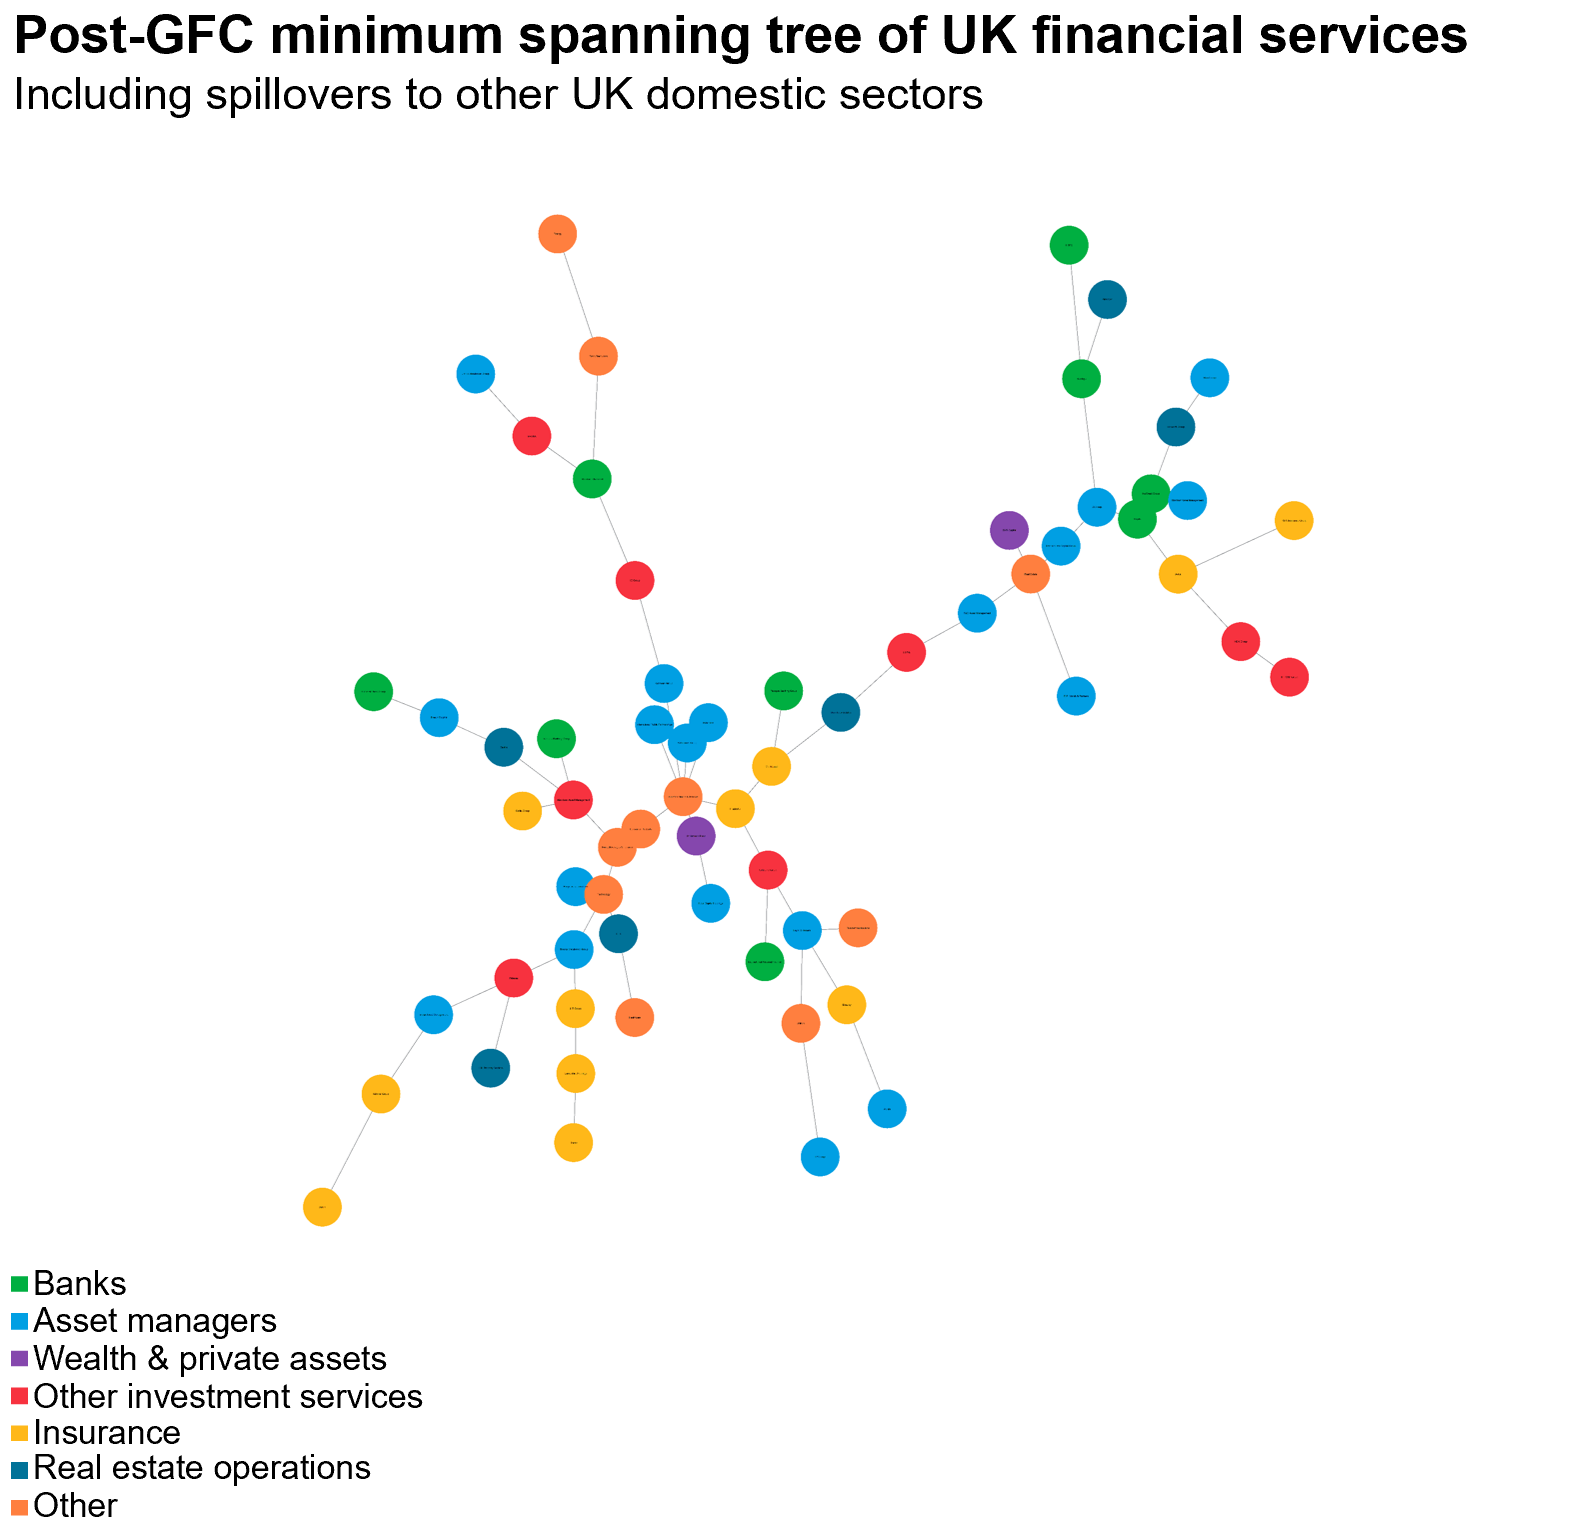
Source: Fathom Consulting
How did Brexit reshape financial networks?
The run-up to the 2016 referendum was characterised by a highly integrated system. The pre-Brexit MSTs show that UK banks were closely connected to European financial services, and asset managers were in an increasingly central position. Brexit disrupted these links. After the vote, UK banks became more dispersed across the network, while UK asset managers clustered more closely together and became even more central. The overall size of the network declined, especially in international connections.
The pre- and post-Brexit DNGs in figure 2 below show that foreign financial institutions, especially in Europe, became less connected to UK firms (although they remained closely connected to each other) and were more often receivers rather than transmitters of risk. In short, Brexit reduced the UK's financial integration with Europe, changing the channels through which shocks could spread.
Figure 2: DNGs of UK financial services pre- and post-Brexit
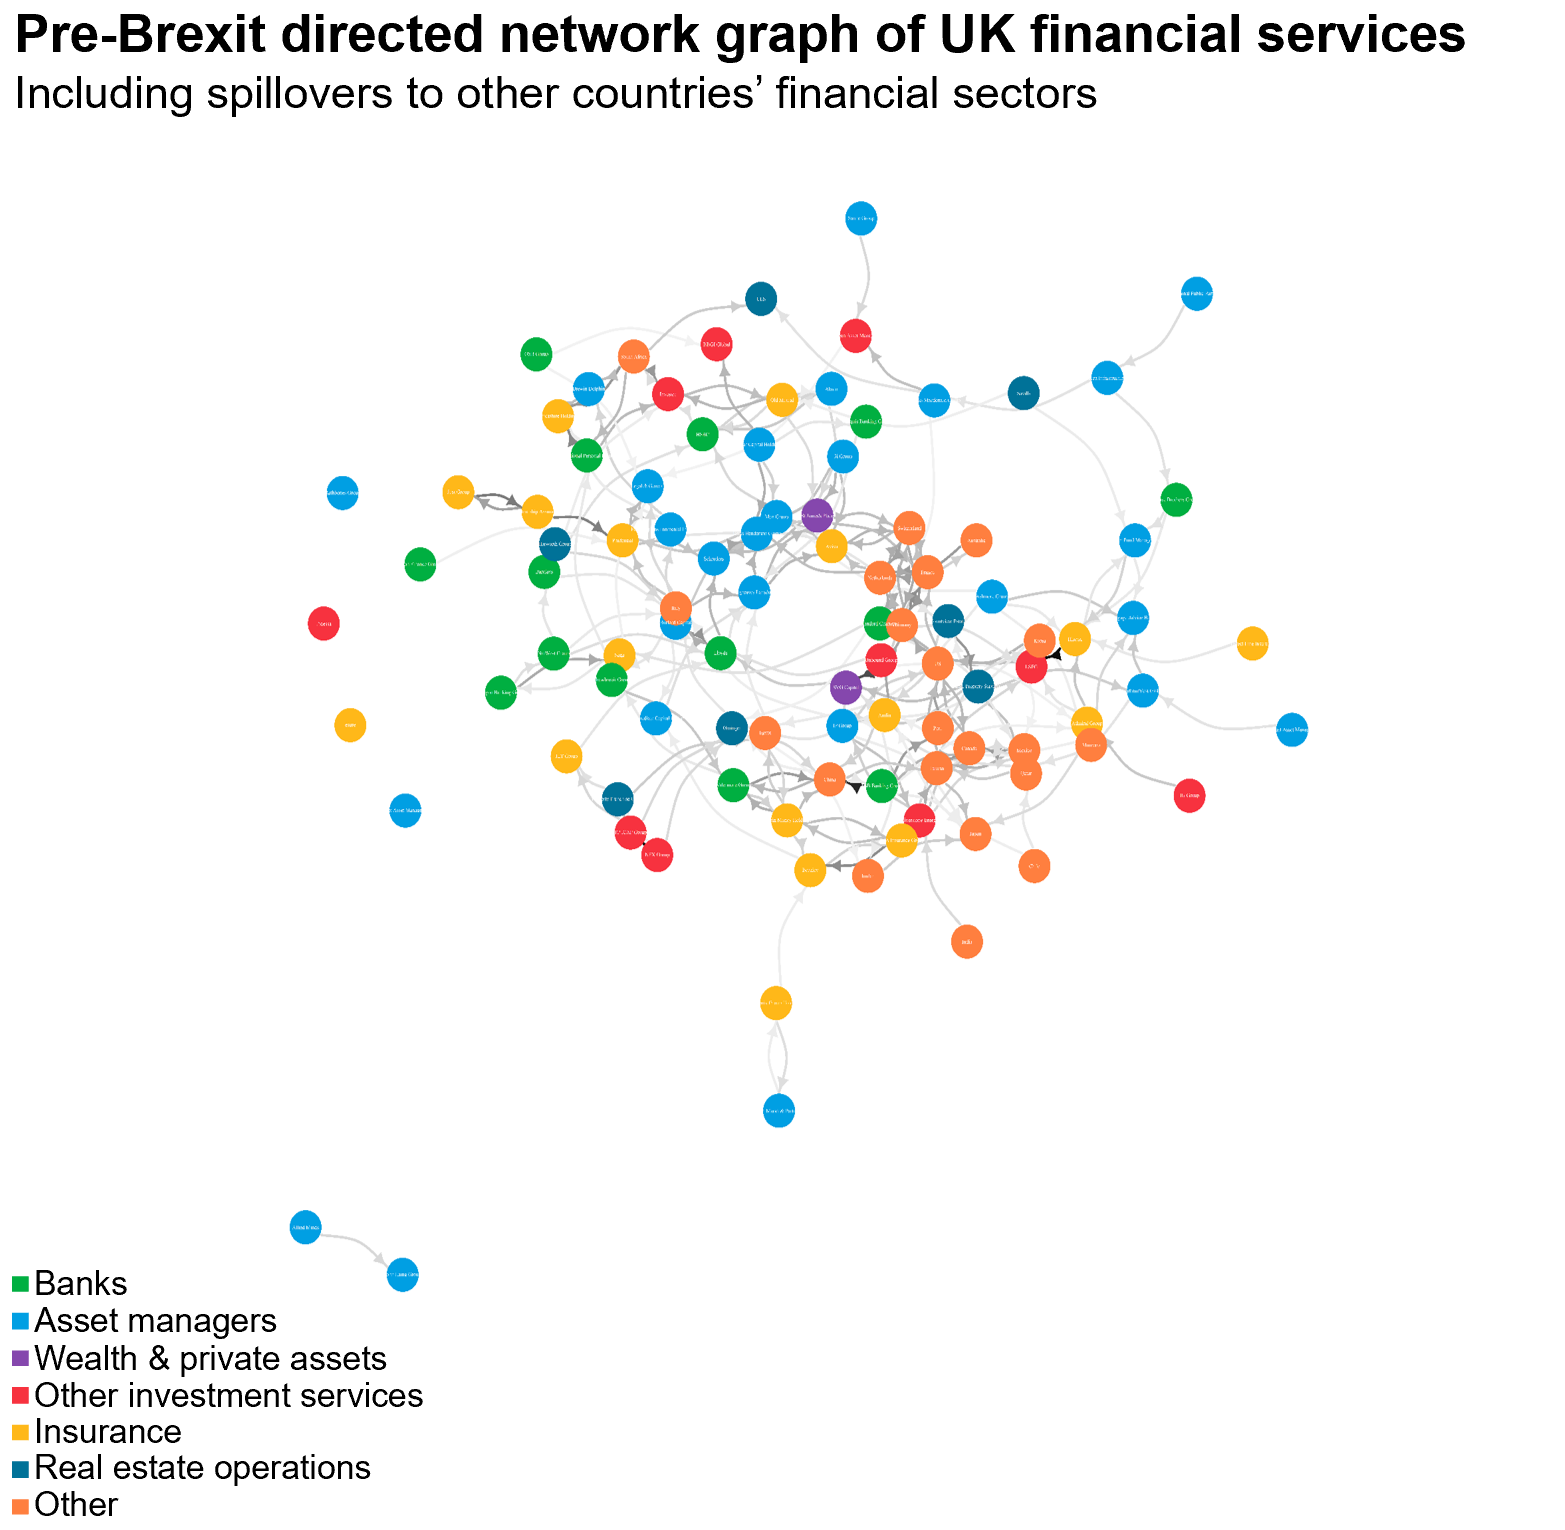
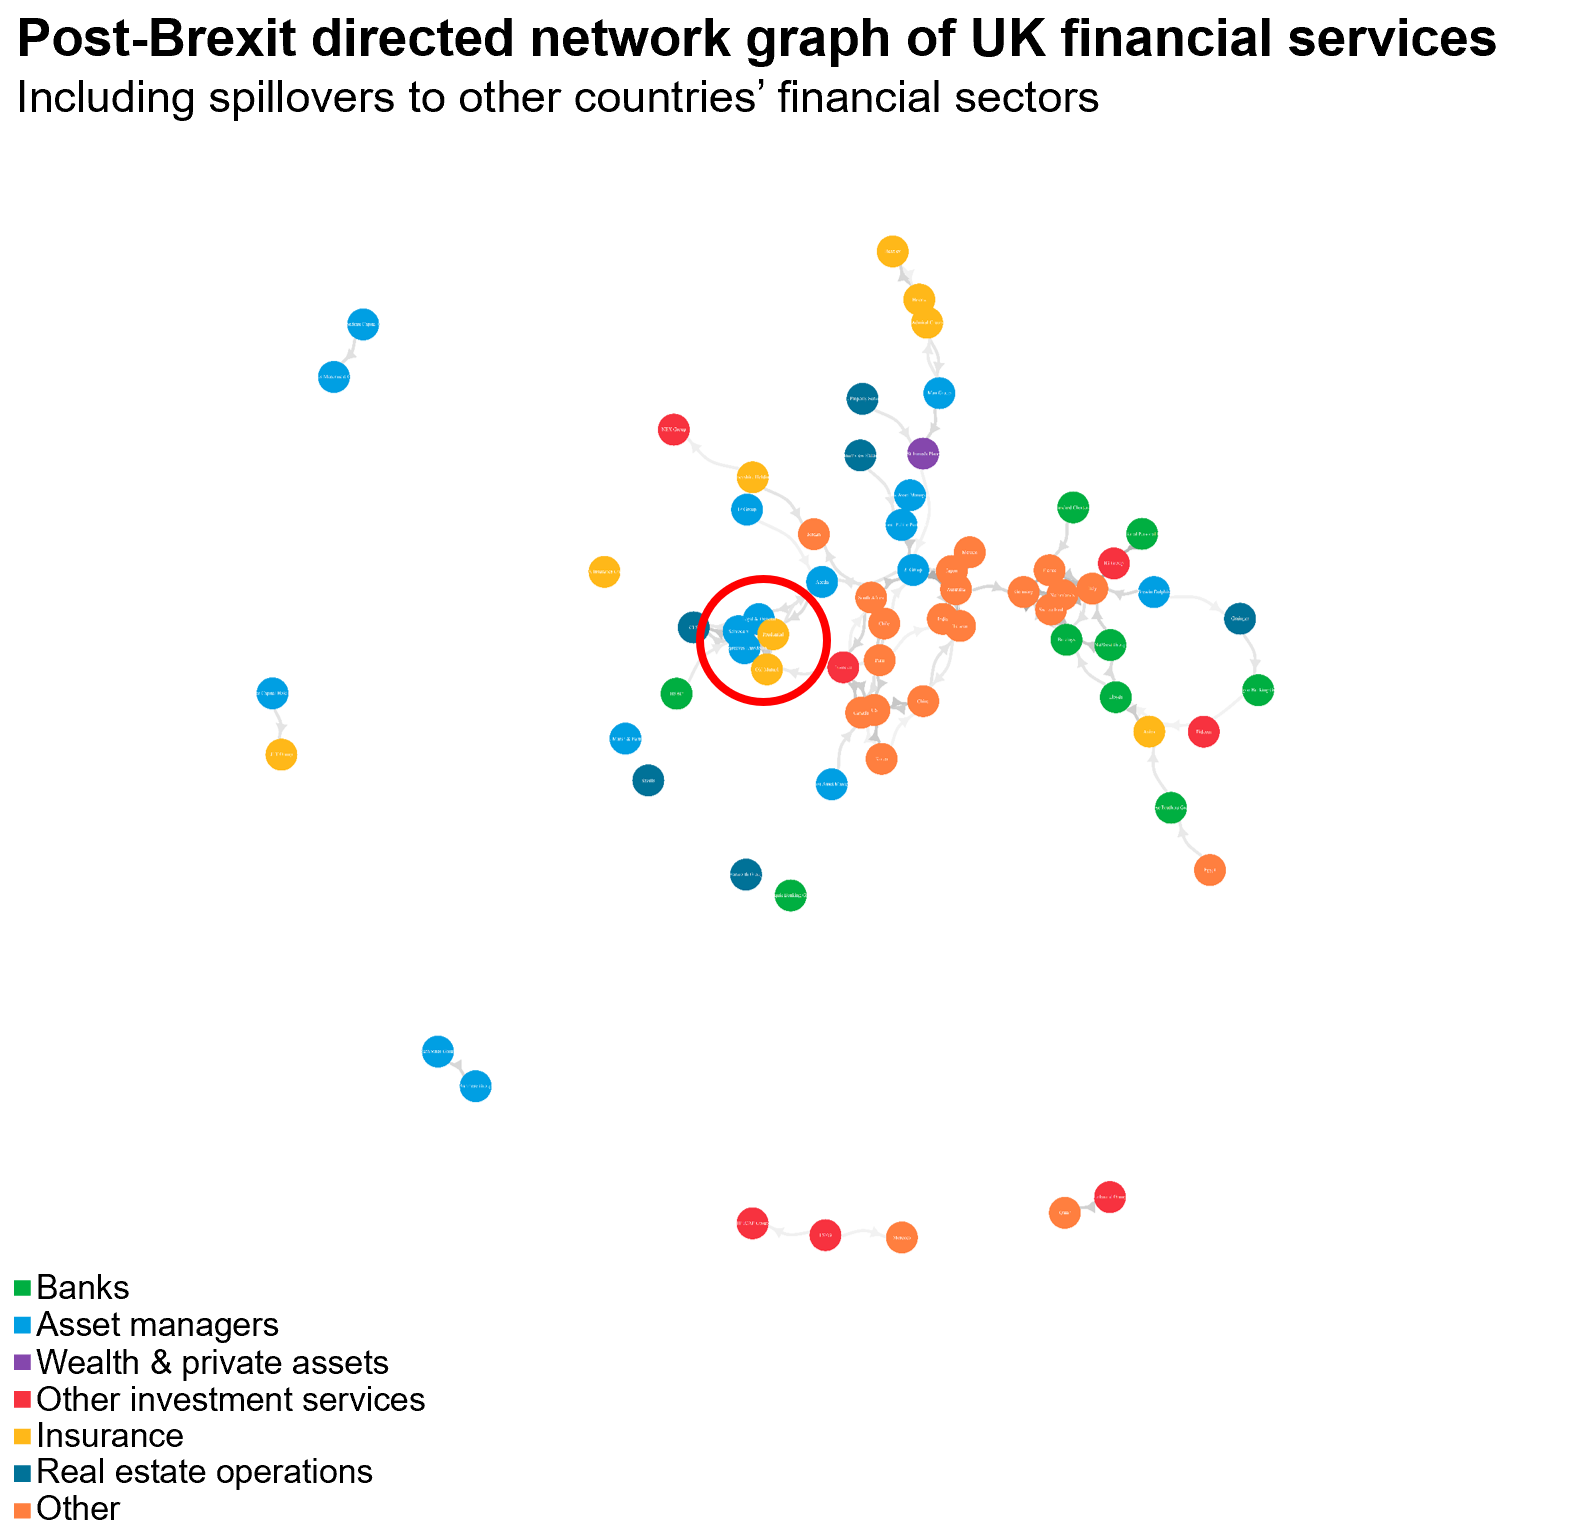
Source: Fathom Consulting
What does the system look like now?
By 2024, the UK financial system has partly rebuilt its international connections. Banks are more diversified, with closer links beyond Europe. The MST in Figure 3 shows a wider network compared with the immediate post-Brexit period, though not so large as before 2008. Insurers, wealth managers and smaller investment services have moved to the periphery, losing centrality. DNGs confirm that risk is now more dispersed, with little clustering among specific types of institutions. There are pockets of close ties – for example, some small banks and asset managers linked to the technology sector – but overall, the system appears more balanced. Still, the persistence of strong mutual links between certain firms means that vulnerabilities remain.
Figure 3: MST of UK financial services in 2024
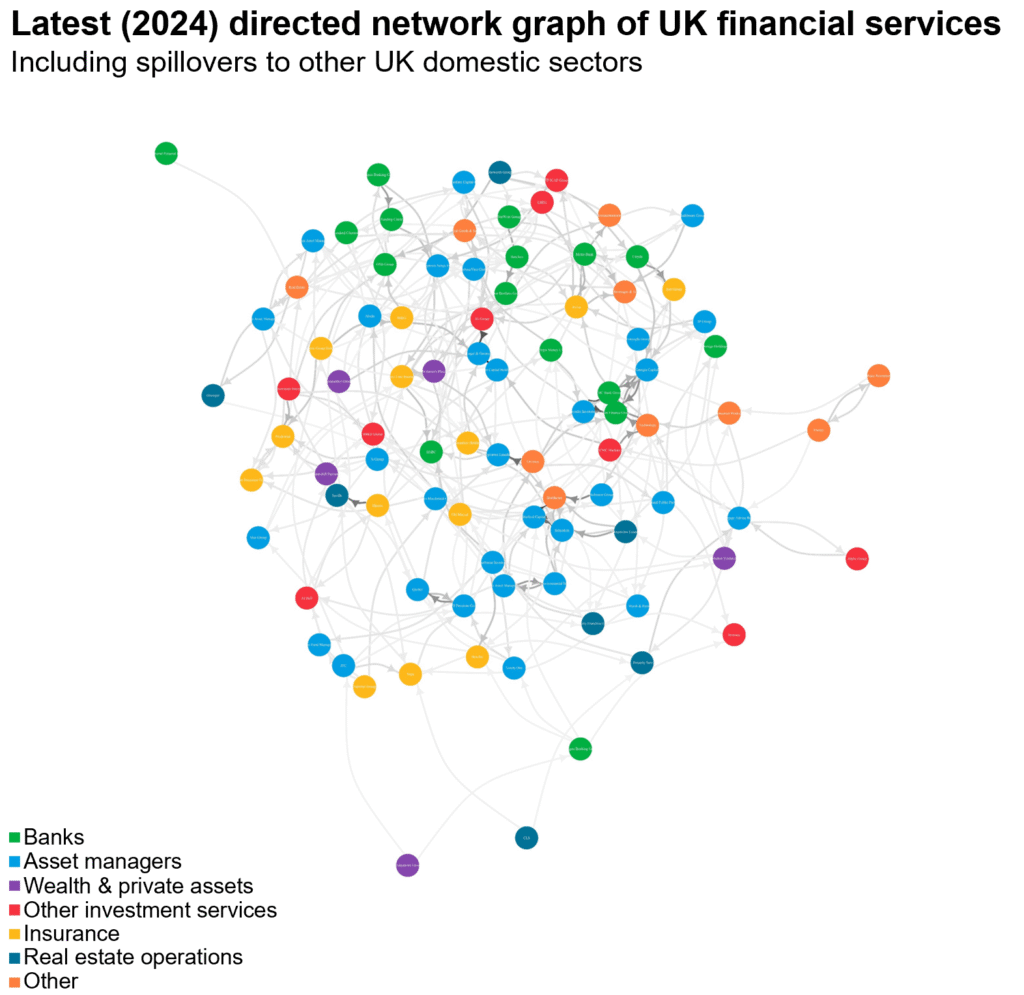
Source: Fathom Consulting
The novel approach that Fathom has developed relies on financial market data, specifically correlations in equity prices. This is powerful because it captures the aggregated knowledge of thousands of traders, embedding real-time information about perceived risks. But there are caveats – correlations that appear in MSTs can also reflect exposure to common factors, such as interest-rate moves, rather than direct connections. Adding DNGs improves reliability by distinguishing between transmitters and receivers of risk.
The evidence from this research is consistent with other studies that have used similar methods, including research on contagion during the collapse of Silicon Valley Bank in 2023. Regulators need access to adaptive tools, including higher-frequency data to monitor contagion in real time and machine-learning methods such as graph neural networks to reveal hidden structures (see Diebold and Yilmaz 2012; Battiston et al. 2015; Bardoscia et al. 2017). Still, these methods cannot replace detailed supervisory data. They should be seen as complementary tools that give regulators faster, more flexible insights.
What else do we need to know?
Research is advancing. Jon Danielsson and Jean-Pierre Zigrand explore how asset management may transmit systemic risk (LSE Business Review 2015). Prasanna Gai and Sujit Kapadia show how interbank networks can become fragile under stress (Gai and Kapadia 2010), while Stefano Battiston has demonstrated how network complexity itself can amplify systemic shocks (Battiston et al. 2015). The Bank of England also provides a clear primer on financial stability (KnowledgeBank explainer).
Conclusion
Fathom’s experiment with network theory offers new insights into financial stability. The evidence suggests that post-crisis reforms worked: today, the domination of banks has been lessened, risk is more dispersed, and the system is less fragile. But it also highlights that new vulnerabilities are emerging in less regulated parts of the system, especially in asset management and insurance. For regulators, the challenge is to keep monitoring these evolving networks and ensure that the next crisis, when it comes, is contained rather than contagious.
Where can I find out more?
- The full FCA-commissioned study by Fathom Consulting is available here. It provides detailed charts and interactive versions of the network diagrams.
- For accessible introductions to financial contagion, see resources such as the Bank of England’s explainer on financial stability, or VoxEU columns on systemic risk.
Who are experts on this question?
- Jon Danielsson
- Jean-Pierre Zigrand
- Prasanna Gai
- Sujit Kapadia
- Stefano Battiston


