While official data points to a ‘productivity miracle’ in several large northern cities since 2019, a closer look suggests otherwise. This serves as a reminder to sense-check any data before using it, regardless of the source.
The UK’s flatlining productivity performance since the global financial crisis is well documented, with negative consequences for wages, tax take and standards of living.
Yet there was some good news in official statistics last year. Several of the UK’s largest cities outside of London, which have been perennial underachievers, seemingly experienced a productivity miracle since 2019. This apparent turnaround has been widely reported and has helped shape policy debates.
But the episode is less a story of northern urban revival than a cautionary tale about how researchers interpret and use data.
The apparent productivity resurgence in Greater Manchester
UK productivity growth has barely increased in real terms since 2008. Output per worker increased by just 0.5% per year on average in the 15 years to 2023. And this is a story that has played out across the country – most notably in London.
But since 2019, there has been a jump in the data in three northern city regions. Greater Manchester, West Yorkshire and the Liverpool City Region all see a sharp rise in output per hour, with Greater Manchester’s performance in particular grabbing headlines (see Figure 1). The latter went from having average annual productivity growth of 0.5% between 2008 and 2019 to 3.3% after 2019 – a staggering improvement.
Figure 1. Productivity in Greater Manchester, indexed, 2004-2023
Source: ONS
Passing the sniff test: does the story tally up?
But how accurate is this picture? While we can’t see inside the black box of the production of official statistics, researchers can do several verifications to test its reliability.
The first rule of research: if the data looks too good to be true, it probably is. After years of tracking the North's economic underperformance, I’d love to celebrate a comeback. But a sudden 'miracle' in urban areas like Greater Manchester doesn't add up when the national economy is flatlining and the region has struggled for decades.
And while data on charts usually feels abstract to the person on the street (remember the infamous ‘That’s your bloody GDP, not ours’ heckle), the rise is so sharp that any such upturn is something that should have been visible in how prosperous people feel.
Now I’m not from the area, so can’t judge firsthand. But if the turn towards populism is a protest against the lack of prosperity, then having Reform UK finish second in three out of five of Greater Manchester’s constituencies in the last General Election does little to back up the figures. (At this point, you may fairly say this is because increases have been captured by the richest. More on this later.)
What about other data sources?
The sniff test only gives grounds to raise suspicions. It’s a signal for economists to verify the data using other data sources. And the progress the ONS has made in recent years on output data makes this possible.
So, let’s start with output – the numerator in the productivity calculation. Something that immediately jumps out is that one-third of Greater Manchester’s output growth came from ‘Legal and Accounting’. This growth was so large that it accounted for 45% of all the UK’s output growth in this sector. While not impossible, this is implausible.
Looking at where in Greater Manchester this growth happened casts further doubt. It was not led by Manchester local authority, but by Trafford, which on its own by this measure accounted for 18% of UK output growth in the sector.
Where in Trafford? A sectoral cut of the output data below the local authority level isn’t available. But jobs data is. And this offers further clues. One medium super output area (MSOA), just north of Altrincham, saw an increase of 21,000 jobs between 2019 and 2023 in the Legal and Accounting category alone. To put this in context, the average total number of jobs in any sector in an MSOA is 4,000. A quick look at satellite imagery (see Image 1) shows that there is nowhere in this suburban area that could house these jobs. It must be a data error.
Image 1. Approximation of the Trafford area linked to productivity surge
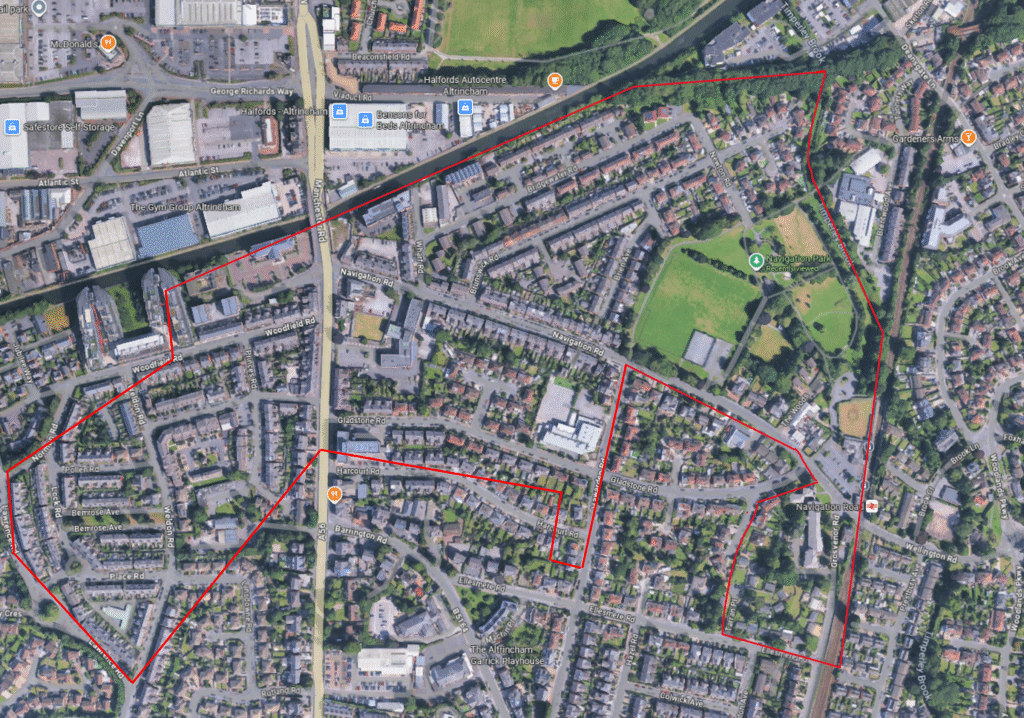
Source: Google Maps
What impact does this have on the city region’s productivity performance? Discounting Trafford’s legal and accounting output growth reduces productivity growth in Greater Manchester between 2019 and 2023 from 14% to 12%.
That on its own isn’t an enormous change. Certainly not enough to change the overall story. There may be other similar issues elsewhere in the data. But without access to the underlying microdata, they aren’t as obvious.
So, let’s turn to the denominator. Work by Centre for Cities shows there are red flags here too. The data reports that total hours worked in Greater Manchester were 2% lower in 2023 than in 2019, despite large jumps in both output and jobs. This seems due to an undercounting of self-employment in more recent years. Adjusting for this change reduces productivity growth further to 9%. While this is still above UK growth of 3%, it starts to speak more to the UK’s underperformance than Greater Manchester’s overperformance.
Another check is to look at data that you’d expect to move in line with productivity. Wages are a good candidate. The wages data has its own pandemic-induced sampling challenges. But if it was to corroborate this story, you’d expect there to be an increase in wages in line with productivity. As Figure 2 shows, this isn’t the case. There was no equivalent jump in pay since 2019, and real median wages increased by just 1%. Now this could be because wage increases were concentrated among the highest earners. But this isn’t the case – the meagre increase in real wages was the result of growth at the poorer end of the distribution, most likely because of minimum wage increases (see Figure 3).
Figure 2. Median wages versus productivity in Greater Manchester, indexed, 2004-2023
Source: ONS; author calculations
Figure 3. Median wage growth across the wage distribution, Greater Manchester
Note: Wage data has been deflated using CPI-H.
Source: ONS; author calculations
How did this affect policy decisions?
I’d like nothing more than for the data to reflect reality. But if it isn’t, recognising that it isn’t is important because it affects policy decisions.
It is plausible that, upon seeing the ONS figures, central government considers the job done in a place like Greater Manchester and focuses resources elsewhere. Given that it is likely overstated, and the impact that the underperformance of Greater Manchester has on the national economy, this would be a mistake.
And it is affecting local policy decisions. For example, Mayor Andy Burnham used the data to justify a series of investment decisions across Greater Manchester guided by the belief that this growth hadn’t spread prosperity everywhere. Sadly, the issue appears to be that the growth didn’t happen, rather than it not being spread sufficiently.
What next for economists and other researchers?
As researchers, controlling our own biases is perhaps one of our biggest challenges. Many who have used this data, seemingly without question, have done so because, understandably, they want to have a good story to tell about large northern cities. But it seems to have injected noise rather than clarity into the debate.
Collecting data is hard. Our work at The Data City reminds us of this every day, and the ONS does an admirable job with the resources it has. But we should not blindly assume that any data with a national statistics stamp on it gives a reflection of reality. This story reminds us as a research community to always exercise a healthy dose of cynicism and always cross-check when it is possible to do so.
Where can I find out more?
- How productive are the UK’s big cities? Report by Yunze Wang
- Welcome to Decline. Blog by Tom Forth
- So you want to level up? Report by Paul Swinney
- Where is all of Manchester’s new wealth going?. Blog by James Gilmour.
Who are experts on this question?
- Henry Overman
- Andrew Carter
- Tom Forth


