Taxing unhealthy foods like sugary drinks makes them relatively more expensive, potentially encouraging people to buy more healthy alternatives. Evidence shows that such taxes do reduce consumption and that firms reformulate their products, with beneficial effects on health.
Taxes on sugary soft drinks have been implemented in many places. In the UK, the Soft Drinks Industry Levy (commonly known as the ‘sugar tax’), which was introduced in March 2018, adds a charge of between 18p and 24p per litre on drinks depending on the quantity of sugar that they contain.
These types of taxes have been effective at reducing consumption of sugary soft drinks, and at encouraging firms to reformulate and reduce the amount of sugar in the drinks they produce. According to one study, the percentage of drinks with over five grams of sugar per 100 millilitres fell from an expected level of 49% to 15% between September 2015 and February 2019.
This suggests that broader taxes that increase the prices of other types of unhealthy food could be effective tools for tackling obesity, although their ultimate success will depend on how consumers and firms respond to their introduction.
Why tax some foods and not others?
Governments commonly use taxes to make some goods more expensive than others to discourage people from purchasing them. These are called ‘corrective taxes’ because they aim to correct the fact that the market price of a product may not fully reflect all the costs associated with consumption, including any to wider society.
These include the costs of treating diseases linked to poor diet, excess alcohol consumption and smoking, which are often borne by publicly funded healthcare systems. If everyone accounted for all the effects and costs – imposed both on themselves in the future and on broader society – that were associated with their consumption, then there would be little reason for government intervention. But if there is a gap between the perceived and actual costs of consumption, then this can lead people to consume more than is ideal. In this case, government intervention to reduce consumption can improve outcomes and people's wellbeing.
Corrective taxes on alcohol, cigarettes, petrol and other fuels have been used for decades. More recently, governments have started to use them to discourage people from eating certain types of foods. For example, as of August 2020, taxes on soft drinks have been introduced in over 50 jurisdictions around the world – see Figure 1.
Figure 1: Sugary drink taxes around the world
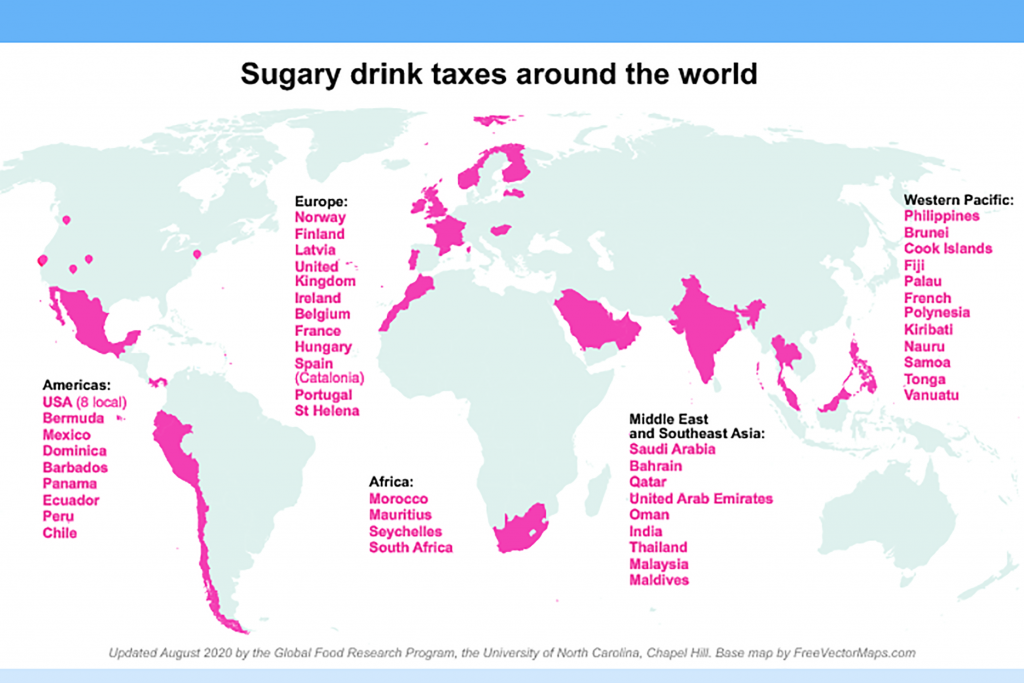
Source: Popkin and Ng, 2021, ‘Sugar-sweetened beverage taxes: Lessons to date and the future of taxation’, PLOS Medicine
Taxes on soft drinks are motivated by concern about excess sugar consumption. People in the UK consume far above recommended levels – Figure 2 shows the average consumption of added sugar at different ages, compared with the medically recommended maximum. As shown, over 80% of people consume more than the recommended levels, and this excess consumption is more pronounced at younger ages.
Figure 2: Sugar consumption compared with recommended maximum, by age
Source: Griffith et al, 2019, Fiscal Studies
There are a number of possible reasons why people may fail to take into account all of the costs associated with the amount of sugar that they eat and drink. Many of these stem from the relationship between excessive sugar consumption, diet-related disease and long-term health, economic and social outcomes.
For example, there is evidence that excessive sugar consumption increases the risk of consuming too many calories, thus contributing to obesity – and that obesity in turn increases the risk of developing heart disease, type-2 diabetes, strokes and some cancers (Scientific Advisory Committee on Nutrition, SACN, 2015). There is evidence that poor diet is responsible for up to 40% of the non-communicable disease burden in Europe (Murray et al, 2012). In addition, excessive sugar consumption is linked to tooth decay, particularly in children.
Many of these health costs resulting from excess sugar consumption will be borne by the individual – for example, through lower quality of life, reduced wages and premature mortality. But society more broadly may also bear some of the costs, such as those associated with publicly funded medical care, and through lost tax revenues and increased benefit payments due to diet-related illness.
In addition, it is likely that the full effects of their decision-making about what to eat and drink may not be considered by individuals themselves at the time of consumption. For example, some people may be unaware of the future impact on health of a high sugar diet or, indeed, of what products are high in sugar.
Children are a particularly compelling example of this: it is unlikely that they are fully able to understand the effects of eating a lot of sugar on their future health and wellbeing. Some individuals might also face self-control problems, which mean that they do not fully consider future health consequences relative to the instantaneous gratification of eating a sugary snack (and hence lead them subsequently to regret their choice).
The aim of the tax is to correct this failure in the market by raising prices so that the perceived costs are brought into line with the actual costs of consuming an additional unit of the product.
In practice, it can be difficult to target the tax on purchases where the costs that an individual faces when deciding what to buy (and how much) are most out of line with the actual costs. This divergence is likely to vary among people and across consumption occasions – in other words, it will not apply at all times. For example, the social costs from an obese person eating an additional chocolate bar are likely to be higher than those from a competitive marathon runner eating the same thing.
Even if we were able to identify the size of the divergence for each individual, it would be difficult to design a tax system that treats people differently. Therefore, any tax is likely to affect not only the people for whom the actual costs are most out of line with their perceived costs, but also the people for whom there is no social or unaccounted-for future private cost (for example, the competitive marathon runner). The tax makes the latter type of individual worse off, since they face a higher price, and there is no benefit to society or to the individual in the future.
This means that there is a balance to strike between reducing the consumption of people who consume more than is ideal and raising the prices faced by individuals whose behaviour does not create any excess costs. When considering the merits of introducing a corrective tax, it is important to consider this trade-off and not simply to focus on a set of problematic individuals and ignore the impact on others.
These complications do not mean that we cannot design effective corrective taxes, but they should be borne in mind when considering the merits of such a policy and in its design.
What impact have taxes on soft drinks had?
The majority of taxes on soft drinks apply to drinks containing added sugar. Such taxes aim to reduce sugar consumption by increasing the price of sugary drinks, which is likely to lead to a reduction in purchases and a commensurate reduction in consumption.
A recent review surveyed the evidence on the impact of soft drinks taxes (Griffith et al, 2019). Among the studies that looked at the effect on prices, all found that taxation increased the prices of soft drinks. In most studies, the estimated ‘pass-through’ was full or near to full – meaning that prices rose by the full amount of the tax.
All studies found that taxes lead to a reduction in purchases:
- The estimated effects on purchases were found to be largest in Philadelphia, where the tax applied to soft drinks containing added sugar and those containing artificial sweeteners (diet soft drinks). The tax led to an increase in prices of around 34% and a reduction in purchases of around 22% (Cawley et al, 2019; Seiler et al, 2018).
- The estimated effects on purchases in Mexico were significant, where the tax led to an increase in prices of approximately 15%, and applied to all soft drinks containing added sugar. It was estimated to have led to falls in soft drink purchases of between 4% and 12%, with a central estimate of a 6% decline (Aguilar et al, 2018; Arteaga et al, 2017; Colchero et al, 2016).
- Several studies look at the effect of the soft drink tax in the city of Berkeley, California, and find small impacts, once account is taken of the fact that some people will go to nearby towns that do not have a tax to make their purchases. The ease of such ‘cross-border shopping’ both dampens the effects of the tax on prices and limits the effect of any price increases on purchases because people can easily shop outside the city (Bollinger and Sexton, 2018; Rojas and Wang, 2017; Silver et al, 2017).
- Other studies find statistically significant reductions in purchases of taxed drinks in Catalonia (Castelló and López-Casasnovas, 2018), Chile (Caro et al, 2018; Nakamura et al, 2018), France (Capacci et al, 2018) and Washington state (Rojas and Wang, 2017).
A tax may also lead to reductions in sugar consumption through other channels; for example, due to product reformulation to lower sugar content, or by conveying information about the health costs of sugar consumption to individuals. The strength of these effects depends on how the tax is structured, as well as how people and firms respond to the tax.
The UK’s Soft Drinks Industry Levy, introduced in 2018, has an unusual structure. A tax of 18p per litre of drink is applied if the drink contains between five and eight grams of sugar per 100 millilitres, and of 24p per litre of drink if it contains over eight grams of sugar per 100 millilitres – see Figure 3.
Figure 3: Tax per gram of sugar under the UK’s Soft Drinks Industry Levy
Source: Soft Drinks Industry Levy Statistics Commentary 2020, HMRC
The tax created a strong incentive to reformulate products to reduce their sugar content to just below five grams of sugar per 100 millilitres. Figure 4 shows the number of products at different levels of sugar content in 2016 and 2019.
In 2016, the largest number of products had around ten grams of sugar per 100 millilitres, which is the sugar content of Coke and Pepsi. In 2019, there were substantial numbers of products with sugar content just below five grams per 100 millilitres that had not been there before. Thus, the introduction of the UK’s soft drink tax seems to have reduced the sugar content of many products, which is likely to have reduced the amount of sugar that people consumed from soft drinks.
Figure 4: Number of sugary soft drink products available by sugary intensity
2016
2019
Source: Authors' calculations using Kantar Worldpanel
What about taxes on other foods?
The apparent success of the taxes on sugary drinks has led to calls for taxes on other unhealthy foods. Whether these will be effective at improving population diet depends crucially on how consumers and firms respond to their introduction.
For example, in the case of soft drinks, there are obvious low sugar (or diet) alternatives that people may find acceptable substitutes. It is unclear how willing people may be to switch from a chocolate bar to an apple if a tax is applied to the former. The extent to which a tax may lead to healthier product offerings depends on how easily firms can alter the nutrient content of their products.
Nonetheless, the evidence from the implementation of soft drinks taxes suggests that corrective taxes can be an effective means of improving people’s diets. Extending them could therefore be a useful tool to tackle the obesity crisis.
Where can I find out more?
- Soda taxes target the young but not individuals with high sugar diets: VoxEU article by Pierre Dubois, Rachel Griffith and Martin O’Connell.
- Using taxation to reduce sugar consumption: Institute for Fiscal Studies (IFS) report by Rachel Griffith, Melanie Luhrmann, Martin O'Connell and Kate Smith.
Who are experts on this question?
- John Cawley, Cornell University
- Rachel Griffith, IFS and University of Manchester
- Martin O'Connell, IFS
- Stephan Seiler, Imperial College London
- Kate Smith, IFS and UCL


