Why have big cities around the world become coronavirus hotspots, while many smaller towns and rural regions have suffered fewer cases and deaths? And what are the roles of urban density and social interaction when global pandemics become more common?
Urban areas, especially megacities, have been hit hardest by Covid-19, although that pattern is shifting as outbreaks spread across countries. There are four main explanations linking urban areas and coronavirus, emphasising density; connectivity; crowded living conditions; and exposed occupations. There is evidence for each, but disentangling their effects is challenging.
A better understanding of the links between Covid-19, urban form and urban conditions will help us to develop more resilient ‘post-virus’ cities. The coming years may see shifts in economic activity away from urban cores towards rural areas. The wider effects of such shifts on economic and social wellbeing are still unclear.
What does the evidence from economic research tell us?
Cities around the world, especially the biggest urban areas, have become coronavirus hotspots, while smaller and rural places have – until recently – been less affected. In the United States, deaths per 100,000 people were highest in large urban counties, followed by suburbs, smaller towns and rural areas (Kolko, 2020a), although that pattern is now shifting towards suburban areas (Kolko, 2020b).
In England and Wales, data from the Office for National Statistics (ONS) show a similar pattern (see Figure 1). In March, adjusted standardised mortality ratios were concentrated in the biggest cities. By the end of May, they were higher in smaller cities (like Preston and Brighton) than the biggest cities (like London, Manchester and Birmingham), and they had risen substantially in rural towns and small hamlets.
Figure 1: Covid-19 deaths per 100,000 people by area type, England and Wales, March-May 2020
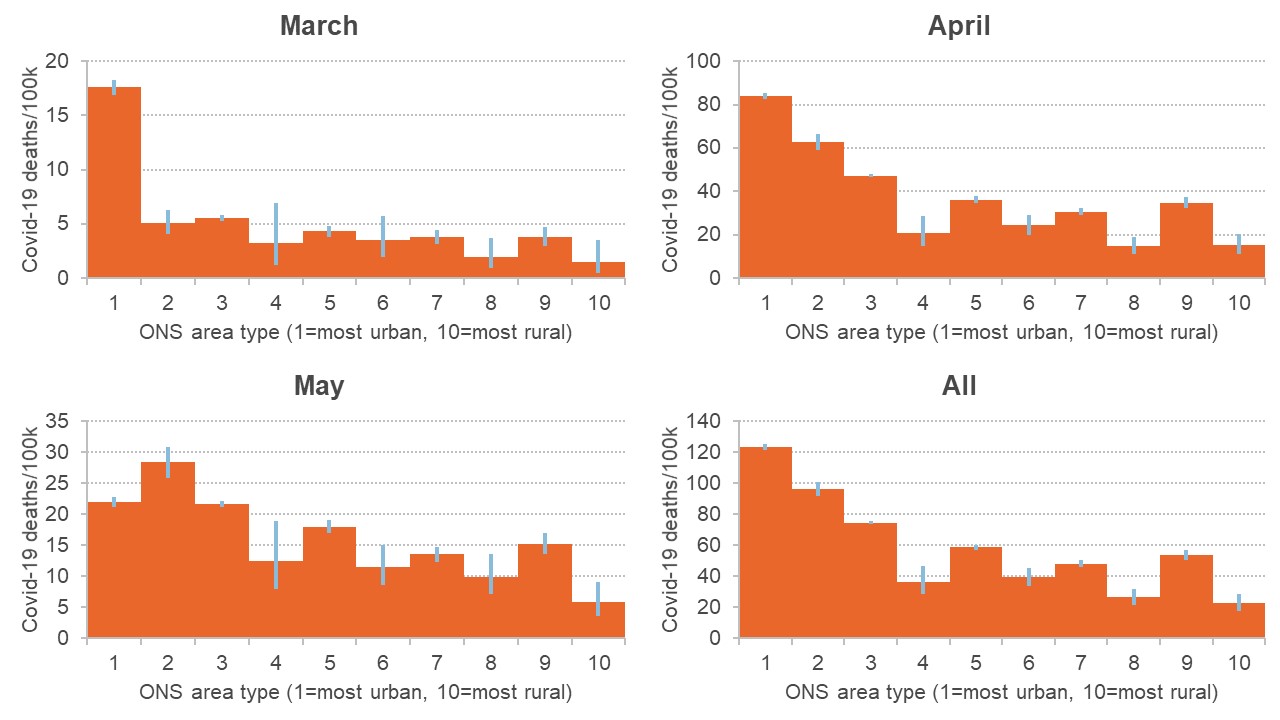
Source: ONS data for England and Wales.
Notes: Age-standardised mortality rates with 95% confidence intervals. Area types: 1: Major conurbation; 2: Minor conurbation; 3: Urban city/town; 4: Rural town/city; 5: Rural town/fringe; 6: Sparse rural town/fringe; 7: Village; 8: Sparse village; 9: Hamlets; 10: Sparse hamlets
Does this mean that people in bigger cities are inherently more at risk? Not necessarily. It’s generally a mistake to read off individuals’ outcomes from area characteristics: statisticians call this an ‘ecological fallacy’ (Singh, 2020). Figure 2 shows that within England, as Covid-19 spread, city-regions like Bristol and Leeds had lower case rates than the rest of the country – and there is a lot of variation within city-regions.
Figure 2: Covid-19 confirmed hospital cases per 100,000 people, English city-regions, 1 February - 1 June 2020
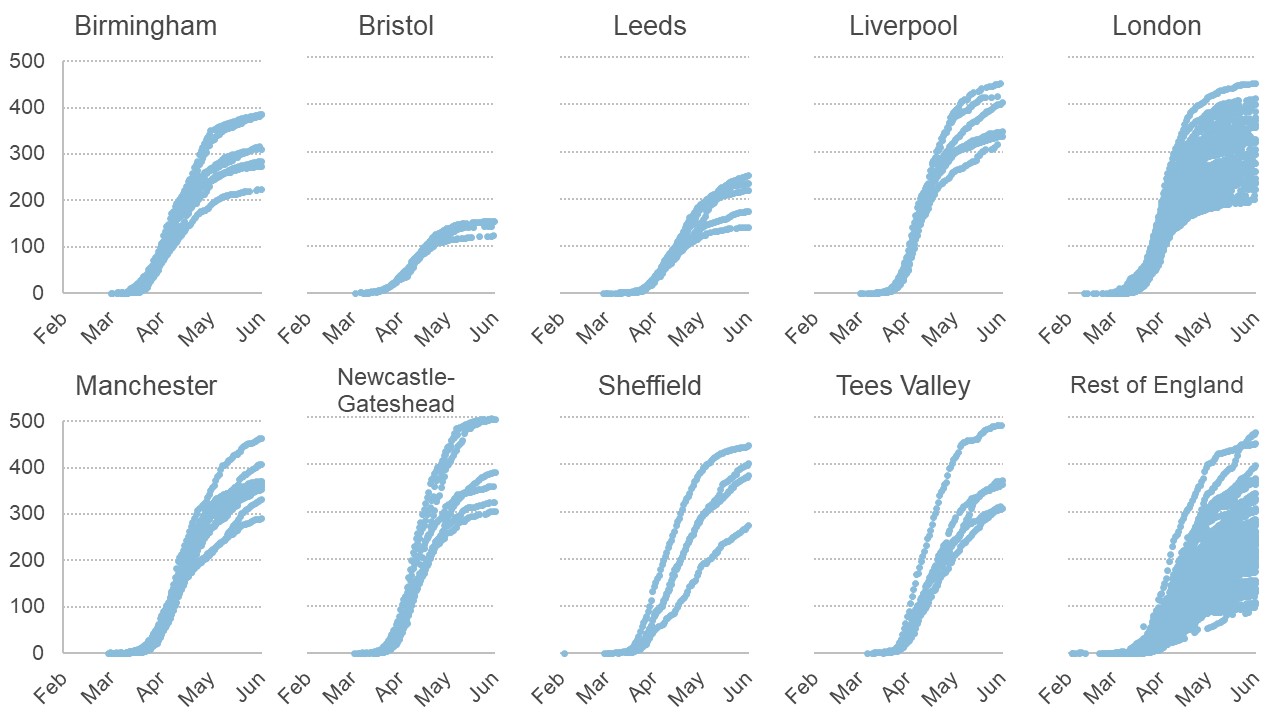
Source: Public Health England data for England, 1 February - 1 June.
Notes: Confirmed hospital cases per 100,000 people for local authorities within city-regions. City-regions defined using combined authority boundaries and GLA boundary for London.
What might explain these patterns? There are four overlapping theories.
Density
Density and social interaction are key features for the success of cities (Duranton and Puga, 2020). But these features are also conduits for the spread of disease. Pandemics through history have tended to hit big cities hardest (The Economist, 2020). Just as agglomeration economies scale with city size, so bigger, more connected cities may be more vulnerable to disease than smaller towns and rural areas (Stier et al, 2020).
As we saw above, evidence suggests a more severe impact of the Covid-19 pandemic in the most densely populated areas such as London and New York – the biggest and densest locations (Cortwright, 2020; Furman Centre, 2020; Kolko, 2020).
Transport networks
Big cities are hubs for international transport networks; they have extensive public transport networks; and they act as commuting hubs for their surrounding city-regions. These channels may help the virus move between city cores and suburbs, and through countries as a whole. There is suggestive evidence that well-networked areas have higher infection rates, controlling for income and density (The Economist, 2020).
A Spanish study using mobile phone data links the high prevalence of Covid-19 in sparsely populated areas with the frequency of weekend trips to and from Madrid before the introduction of lockdown measures (Mazzoli et al, 2020). Other evidence suggests that supply chain networks helped to spread Covid-19 between relatively low-density industrial clusters (Bishop and Marema, 2020).
Crowded housing
Crowding brings people into sustained close contact. In England, there is a clear association between crowding and Covid-19 cases, especially in multi-generational households (Holden and Kenway, 2020). This implies that cases – and deaths – will be higher in poorer versus richer cities, in more crowded neighbourhoods within cities, and among groups most affected by urban housing crises. In turn, Covid-19 outbreaks should be worse in the biggest and most expensive cities, such as London.
Industry and occupational structure
Work differs significantly between urban and rural areas. Jobs in cities, especially big cities, are more likely to be in services sectors, highly dependent on physical proximity and face-to-face interactions, while rural jobs are largely geared towards manufacturing industries and less reliant on social interaction (Abel et al, 2014).
Urban labour markets have increasingly polarised into high-wage knowledge-intensive work and low-wage, low-skilled service roles (Autor, 2020). Both sets of jobs depend on face-to-face interaction, but while the first group of workers have the possibility of working from home, the second group often cannot. In the UK, younger, poorer (and some minority ethnic) people outside the Greater South East are least likely to be working from home (ONS, 2019). Again, this suggests that Covid-19 will have unequal effects both across and within cities.
Related question: What has coronavirus taught us about working from home?
Taken together, these four theories also imply that the impact of coronavirus within cities will be very unequal. Specifically, Covid-19 will do more damage in more unequal cities and among neighbourhoods and groups most affected by economic deprivation.
In this respect, there is growing evidence on the link between Covid-19 outcomes, area deprivation and demography. Covid-19 related deaths are linked to minority ethnic status and to higher deprivation, partly reflecting socio-economic disadvantage, and largely urban location, type of work and household structures (ONS, 2020; OpenSAFELY Collaborative, 2020).
A striking ONS analysis also identifies the UK jobs most likely to be in frequent contact with people and exposed to disease (ONS, 2020). This workforce – including health and care sector workers, rank and file police, hairdressers, bar staff, primary and nursery teachers – is more women than men, around one in five minority ethnic (twice the population share) and has a large minority earning below median wages. Many of these workers – as well as security guards and bus/taxi drivers – also have very high Covid-19 death rates.
Related question: How is the crisis affecting inequalities across ethnic groups?
How reliable is the evidence?
Explaining urban-rural differences in the prevalence of Covid-19 is not clear-cut. First, the majority of evidence to date is based on correlations, and different factors are closely related to each other (Kolko, 2020; Nathan, 2020). Densely populated metropolises are more likely to have large public transport systems, more face-to-face interaction occupations, and greater within-home overcrowding and higher levels of income inequality than rural areas. It is not straightforward to disentangle the relative importance of these factors.
Figure 3: UK change in workplace, retail and leisure travel mobility by density of area
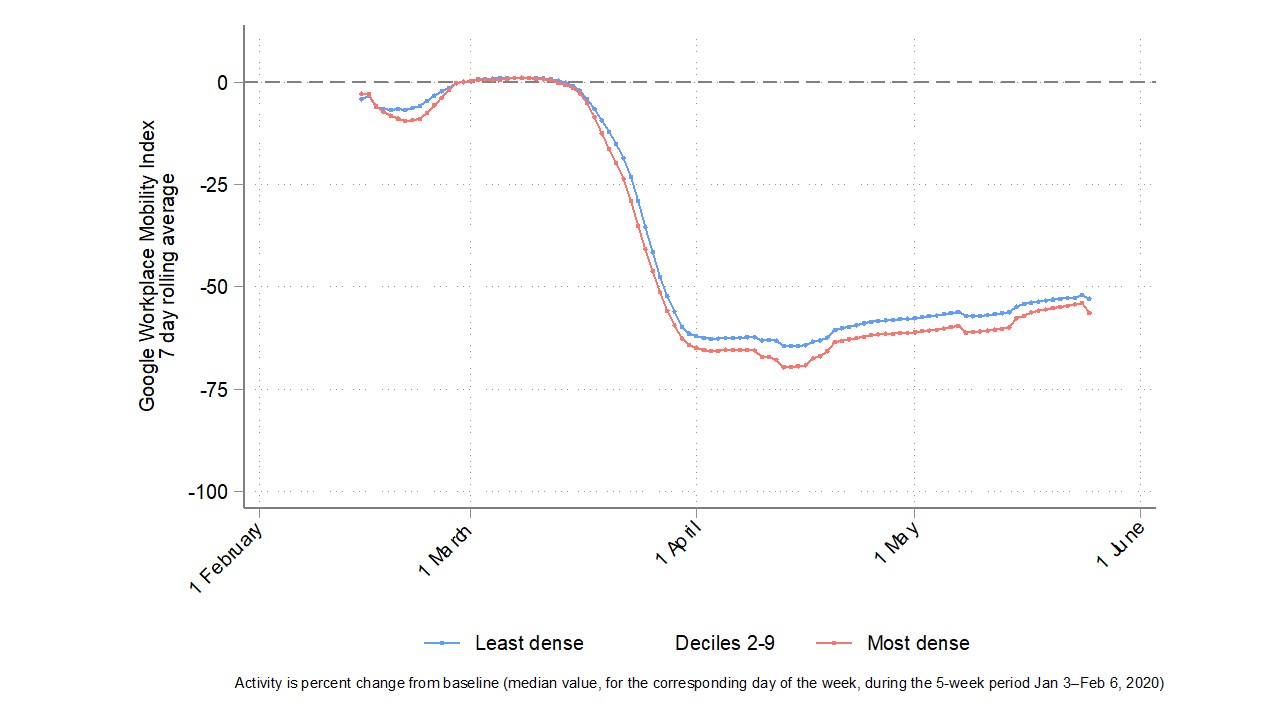
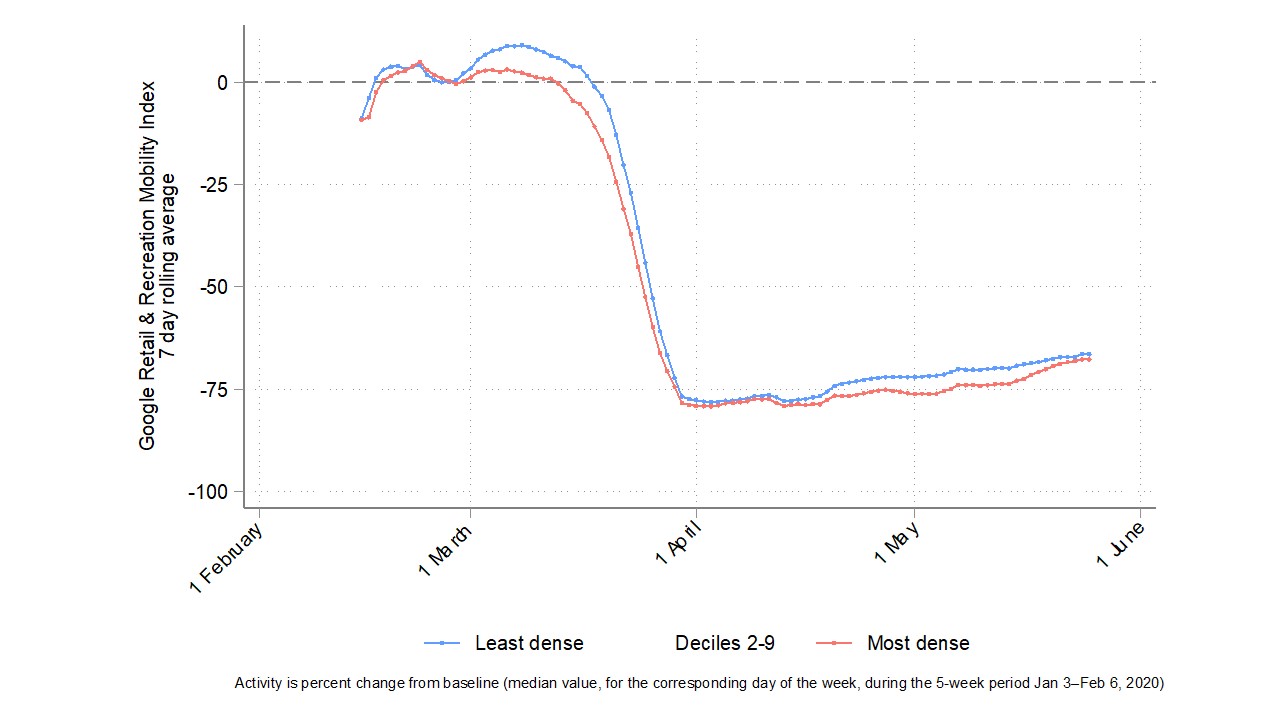
Source: Google Community Mobility initiative.
Notes: Vertical axis shows the percentage change in visits to workplaces (top) and retail & recreational places (bottom), by density of the geographical area.
Second, both the pandemic and responses to it are dynamic. As outbreaks move through space, people change their behaviour if they can, and the size of the response varies across cities and rural areas. Figure 3, using Google mobility data, shows that work and non-work mobility has decreased more in the densest areas of the UK.
Notably, we can see a bigger response in the densest areas before the UK’s lockdown policies took effect. This is consistent with other UK and US evidence (Dave et al, 2020; Ramuni, 2020), and with US evidence that lockdowns had bigger health benefits in denser places (Dave et al, 2020). Citizen response may help to explain why density seems to get less important in explaining coronavirus cases over time (Almagro and Orane-Hutchinson, 2020).
But how people respond will itself be driven by an area’s overall outbreak and its occupational structure. The extent to which people can effectively socially distance is shaped by their economic and household circumstances – those in ‘essential’ jobs and crowded homes can’t do this easily.
What else do we need to know?
Urban density and interaction are key factors in national economic growth over the last century. It is therefore critically important that we also understand the roles of density and interaction in a world in which global pandemics become more common.
For economists, this research agenda is growing rapidly (Avery et al, 2020), at least among those with the time to write under lockdown (Amano-Patiño et al, 2020). This work will be vital for the design of urban infrastructure and urban policies in a world in which global pandemics are more common.
On top of understanding how different urban features may contribute to the spread of Covid-19 and other diseases, we need to know more about how these features contribute to differences in health outcomes for different types of people. In particular, we need to know more about the role of occupations, particularly those with a high degree of face-to-face interaction, in the spread of Covid-19. And we need to understand better how the rural and urban workforces will change following the pandemic.
Overall, the need for dense cities will not go away, and cities have proven to be able to adapt quickly, especially to previous pandemics (The Economist, 2020). This implies that even permanent social distancing measures post-lockdown are unlikely to affect the growth of cities as thriving centres of production.
We may, however, see changes in the way we use cities, and which may in turn rebalance activity between urban and rural centres. For example, permanent shifts to remote working may lead many ‘knowledge workers’ to move out of urban areas. This might improve wellbeing (by reducing commuting times) or hurt it (by reducing workplace interactions and social capital).
These shifts are likely to be partial, as many occupations found in cities cannot work from home (Dingel and Neiman, 2020). They may also hurt productivity, as most existing evidence suggests that teleworking is an imperfect substitute for face-to-face interactions (Buchel and von Ehrlich, 2017). While many managers seem positive about remote working (Ozimek, 2020), many workers report extensive ‘Zoom fatigue’ (Sacasas, 2020).
Related question: Who can work from home and how does it affect their productivity?
The system-wide consequences of these shifts are very hard to predict. One recent study suggests that in some urban centres, high-skilled workers who can work from home will leave urban centres in favour of larger, more rural, homes. This will lead to a decline in urban housing costs, allowing lower-paid workers who cannot work from home to relocate to urban centres. Overall, this modelling predicts that urban-rural inequality will decrease, as will workers’ commuting times (Deleventhal et al, 2020).
Overall, cities are likely to be resilient to this crisis, despite the higher risk faced. Urban density will still play a key role for economic growth, but much depends on how cities will be able to adapt to the new challenges, in particular in public transport networks, amenities, housing conditions and the protection of exposed workers and communities.
Where can I find out more?
The geography of coronavirus: US urban studies expert Richard Florida on what we know about the types of places that are more susceptible to the spread of Covid-19.
Covid-19 and the future of cities: Video discussion with Diego Puga, Edward Glaeser and Jessie Handbury.
What does Covid-19 mean for cities?: Freakonomics audio conversation with Edward Glaeser,
The city and the virus: Max Nathan on why cities are the epicentres of the pandemic and, as countries start to move out of lockdown, what will come next.
What does the Covid-19 crisis mean for the economies of British cities and large towns? Kathrin Enenkel writing on the Centre for Cities blog.
Density is normally good for us; that will be true after coronavirus, too: Emily Badger in the New York Times notes that the very thing that has made cities vulnerable in a pandemic has protected them in other disasters.
The pandemic is killing the attraction of megacities: Camilla Cavendish writing in the Financial Times.
Who are UK experts on this question?
- Diane Coyle (Cambridge)
- Paul Cheshire (LSE)
- Philip McCann (University of Sheffield)
- Max Nathan (UCL)
- Henry Overman (LSE)
- Helen Simpson (University of Bristol)


