Share prices around the world fell dramatically earlier this year amid fears about the financial implications of the pandemic, but since then prices have recovered around half of their losses. How can we explain what has been happening on the stock market?
Between 19 February and 23 March, the share prices of the largest companies in the UK fell by 33%. Over the past three centuries, the only other times when prices have fallen so far, so quickly, were in 1720, during the South Sea Bubble, and in the 1987 crash.
Stock markets across the world have followed a similar pattern, as Figure 1 shows, but prices have since risen again, recovering about half of their previous losses by the end of April. How can we explain what has been happening on the stock market?
Did traders over-react to the initial fears? Renowned investor Warren Buffett has previously argued that crises can provide good opportunities to buy, and that investors should be ‘greedy when others are fearful’.
Or, after the initial crash, have investors subsequently been too optimistic? The Economist (9 May 2020) has argued that there is now a dangerous gap between the markets and the real economy. Elon Musk also tweeted that he thought the stock price of his own company, Tesla, was too high.
Figure 1: MSCI World Index in 2020
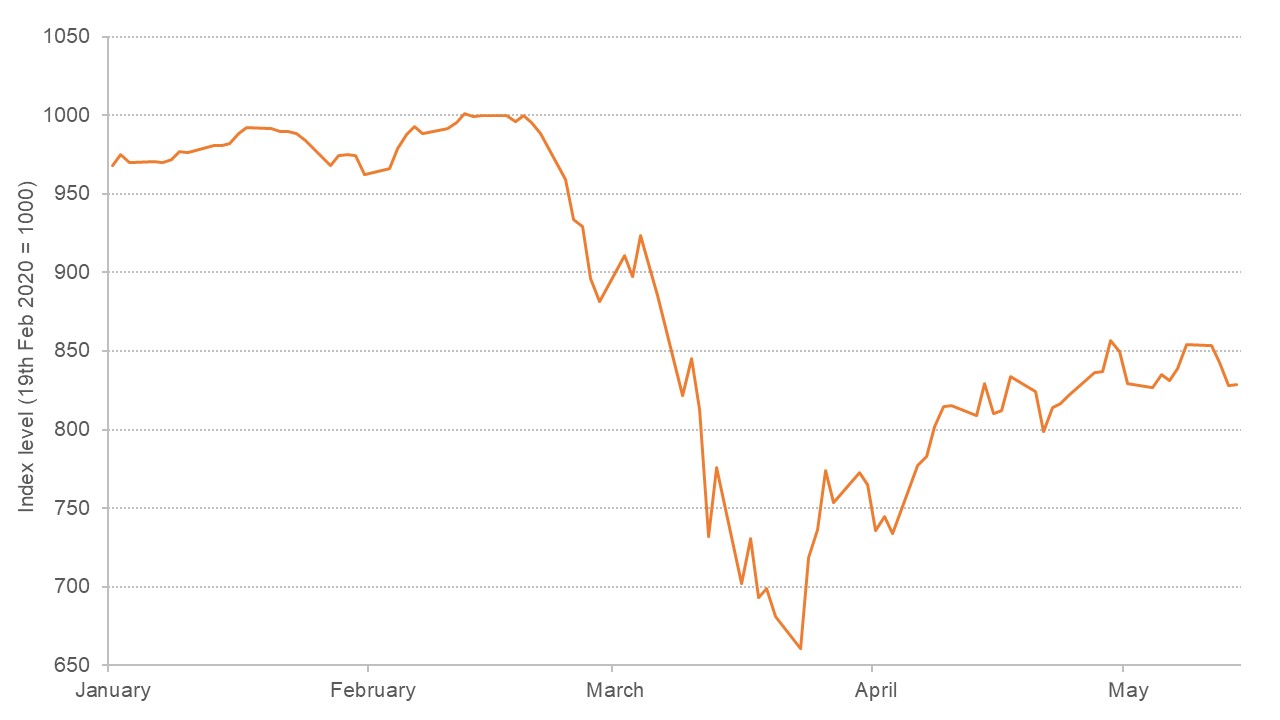
Notes: Calculated from data accessed from Datastream.
What does evidence from economic research tell us?
- The fundamental approach to stock valuation says that the price of a share should depend on expectations about ‘discounted cash flows’ – that is, the amount of cash that a company will generate in the future adjusted for the rate of return expected by investors.
- The ‘efficient markets hypothesis’ argues that share prices are likely to reflect all current information. If there is obvious mispricing, it should be quickly exploited by informed traders to bring the price to its fair value.
- Movements in share prices across countries could have been driven by a combination of domestic issues, interdependence between economies, and financial ‘contagion’.
How reliable is the evidence?
The concept of discounting future cash flows is very well established, and forms the basis of pricing in most financial markets. For centuries, there has been a process known as ‘discounting’, most clearly observed in the valuation of bonds where the future cash flows are known, and the market price reflects a discount based on the required interest rate. This approach has also been long established in the valuation of companies, with contributions made by researchers such as economics Nobel laureates Modigliani and Miller (1958).
Other simpler approaches based on price ratios are also still used by practitioners, but discounted cash flows is the theoretically most advanced model. It is widely used in industry, and is a core part of textbooks on equity valuation, such as those published by the Chartered Financial Analyst institute (Pinto et al, 2019, and Pinto et al, 2020).
But the pricing of assets remains quite subjective, as it is often not clear what future cash flows will be earned, or what the rate of interest should be. This is why prices fluctuate so much. Nevertheless, it can be useful to consider differences between assets to evaluate whether the patterns seem consistent with what may happen to their discounted cash flows.
The biggest losers – and the few winners – during the Covid-19 pandemic are shown in Table 1. These changes could plausibly be explained within a framework using discounted cash flows.
Energy firms have been hit by lower demand, and falling oil prices, which will reduce profits. Flights have been drastically reduced, and there will be difficulties maintaining social distancing on aeroplanes in future, which will also hurt the profitability of airlines. Banks and consumer finance providers may face an increase in bad debts if individuals lose their jobs and businesses start to fail. Expectations of lower growth and higher risk have therefore resulted in lower valuations.
In contrast, the use of healthcare technology is likely to increase, and more shopping is being done online, which should raise future cash flows for firms in these sectors, leading to higher valuations.
Table 1: Returns by sector
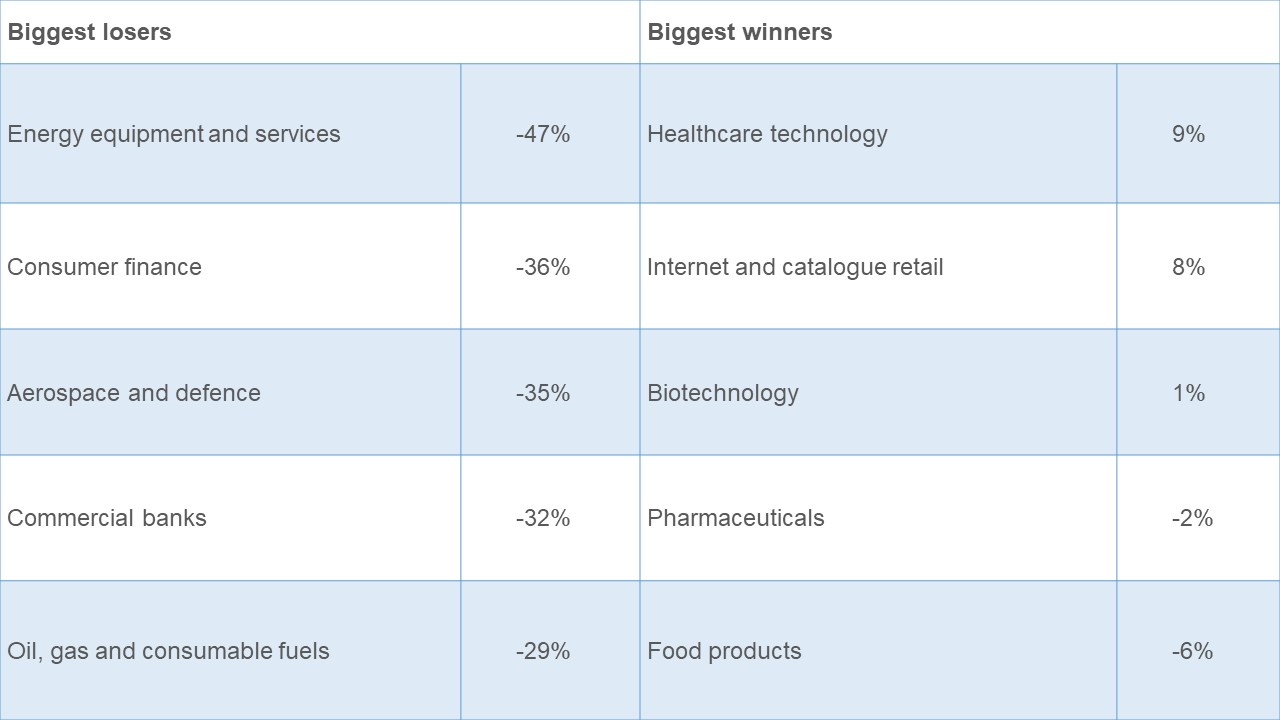
Notes: Calculated from MSCI World Sector Indices between 19 February and 30 April 2020, with data accessed from Datastream.
Due to uncertainty about the future, investors must come up with their own forecasts, and buy or sell based on this. The efficient markets hypothesis argues that markets effectively aggregate the views of investors, and prices should fully reflect the available information (Fama, 1970).
But there has been evidence of over-reaction, under-reaction, momentum and bubbles in share prices (De Bondt and Thaler, 1985, Jegadeesh and Titman, 1993, Greenwood et al, 2019). An extensive body of research has identified hundreds of possible asset pricing anomalies (Green et al, 2013). Some theoretical models argue that although some investors may focus on fundamental information, other traders may extrapolate based on recent price trends (Hong and Stein, 2002, Barberis et al, 2018).
Nevertheless, analysis of the performance of professional active fund managers suggests that it is very difficult to outperform the market average consistently (Morningstar, 2019). As Malkiel (2020) has recently noted, the efficient markets hypothesis does not imply that prices will always be ‘correct’, but the key insight is that ‘we can never be sure whether they are too high or too low’.
Market prices should generally represent the best estimate of investors given the information that is currently available, with expectations playing a key role in how the market functions. The timing of price changes during the Covid-19 pandemic can be understood within this framework, with the UK shown as an example in Figure 2.
The FTSE All-Share started to decline in late February, when only a few isolated cases had actually been diagnosed in England. Prices had fallen by 20% by 9 March, when the number of new daily cases was about 100, and continued to fall until 23 March when about 2,000 new cases were being diagnosed per day. But although the number of new daily cases would rise much further, the market then rebounded.
The declines were driven by fear about the severity of the pandemic, and uncertainty about how companies could survive. The rise in prices came after the introduction of measures that would reduce the spread of the virus, with the prime minister announcing a national lockdown on 23 March, coinciding with the trough in share prices.
Over the previous few days, there had also been announcements of substantial fiscal and monetary stimulus packages. The Chancellor revealed that the government would cover 80% of wages for employees who could not work. The Bank of England cut interest rates to 0.1%, and promised a £200 billion programme of quantitative easing (QE). Recent research finds that previous QE packages have encouraged firms to increase dividends, which can be attractive to investors (Todorov, 2020). Other stimulus packages were also announced in the United States and Europe around the same time.
Figure 2: FTSE All-Share and Covid-19 cases in England
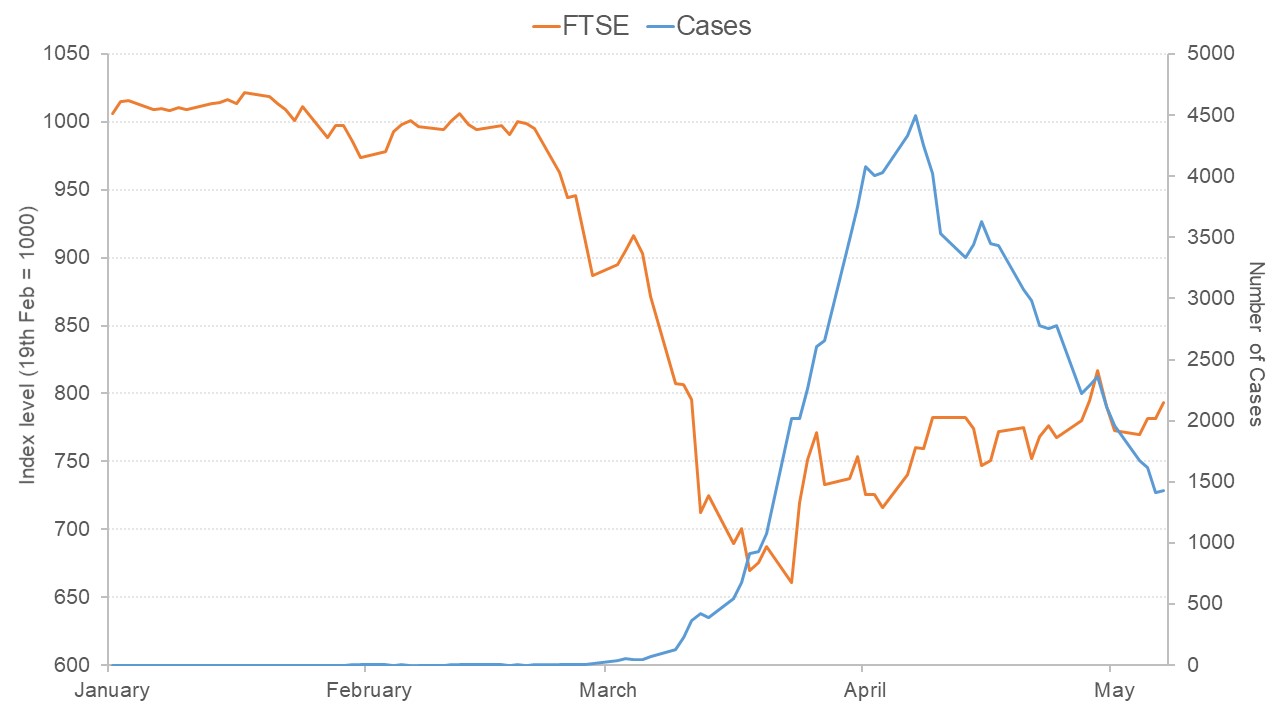
Notes: FTSE All-Share index calculated from data accessed from Datastream. Covid-19 cases in England accessed from http://coronavirus.data.gov.uk.
Covid-19 has affected countries throughout the world, and stock markets in different regions have likewise been affected. In previous, mainly financial, crises there has also been evidence of a high correlation between markets. The movements in each market could have been driven by domestic issues, by interdependence with other countries that are affected, or by financial market contagion, which is unexplained by fundamentals.
For the 2008/09 global financial crisis, research finds that interdependence explains some of the transmission from the United States to other countries, as does contagion, but investors focused more on county-specific characteristics such as poor macroeconomic fundamentals (Bekaert et al, 2014).
The recent patterns in stock market returns across the world can also be considered within this categorisation. The market in China remained steady during January and February, despite the domestic impact of the first phase of the pandemic. But the market then started to decline in March, which is likely to have reflected the expected impact of a reduction in global demand for exports, but to a lesser extent than the major Western countries that have been most affected.
Italy was the first European country to be severely affected by the virus, and its market fell deeper and faster than others, declining by almost 40% by 12 March; and it has only moderately recovered, still being down by 35% in mid-May. Spain has also been deeply affected, and its market has followed a similar path to Italy.
Although Germany had relatively fewer fatalities from the virus, its market has also suffered with a similar performance to the UK, and worse than the United States, possibly reflecting the potential impact on its exports.
Figure 3: Market indices in selected countries
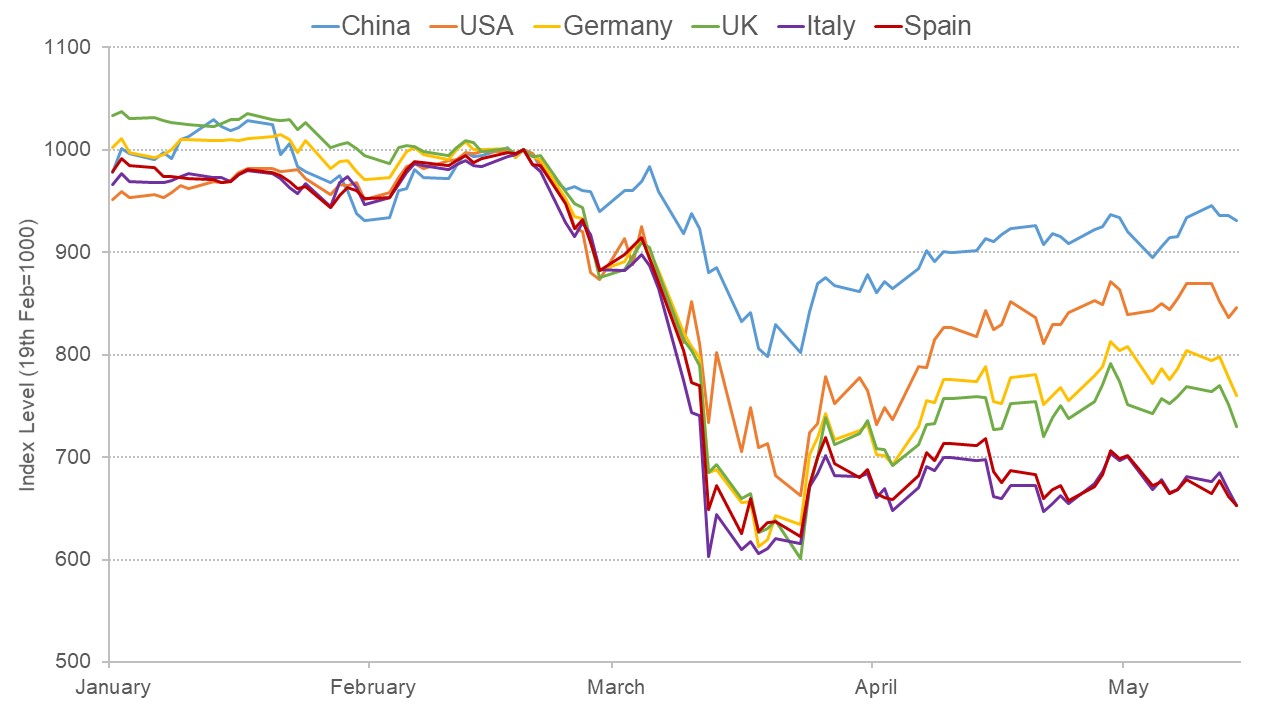
Notes: Calculated from MSCI country indices expressed in US dollars, with data accessed from Datastream
What else do we need to know?
Although the markets have been through numerous crashes and recoveries before, the severity of the shutdown in economic activity around the world is unprecedented. The markets will continually update prices as new information becomes available. As companies begin to release details of profitability, the extent of the real impact on fundamentals will become clearer. The implications of the fiscal and monetary stimulus packages will also be considered.
In addition, the development of possible treatments and vaccines will be closely followed, as these will be key in terms of estimating what the long-term impact on the economy will be.
Where can I find out more?
Does Covid-19 prove the stock market is inefficient?: Burton Malkiel argues that markets are efficient as there is little evidence of investors systematically exploiting mispricing, while economics Nobel laureate Robert Shiller suggests that prices are driven by popular narratives.
Coronavirus: impact on stock prices and growth expectations: Niels Joachim Gormsen and Ralph Koijen use dividend futures to reveal that in mid-March, the market expected dividends to fall by about 25% over the next year.
The market v the real economy – a dangerous gap: The Economist argues that financial markets have recovered more quickly than is consistent with the health of the wider economy.
Share prices allow us to see the future: Rachel Griffith, Peter Levell and Rebekah Stroud discuss why share prices are informative on the Discover Economics blog.
Who are UK experts on this question?
Leading experts in asset pricing in the UK:
- Elroy Dimson
- Franklin Allen


