[A&E Map]
- One of the NHS's key performance indicators is A&E Performance - 4 hour target
- The Data is available online but hard to access
- This explains how to find, clean and present NHS England waiting time data
NHS England Data
NHS England publishes its A&E attendance and admissions statistics, alongside other data, on its website, here. On the second Thursday of each month, the previous month's performance statistics are published. These data report adherence to the 4 hour A&E target at the system and provider levels and break down admissions by department types.
Unfortunately, each NHS release is just a cross-section; each month's data is released on its own, making comparisons over time difficult. To build a panel of NHS trusts' A&E performance, we must download and merge 13 years of separate monthly releases.
1. Finding A&E Stats Index Pages
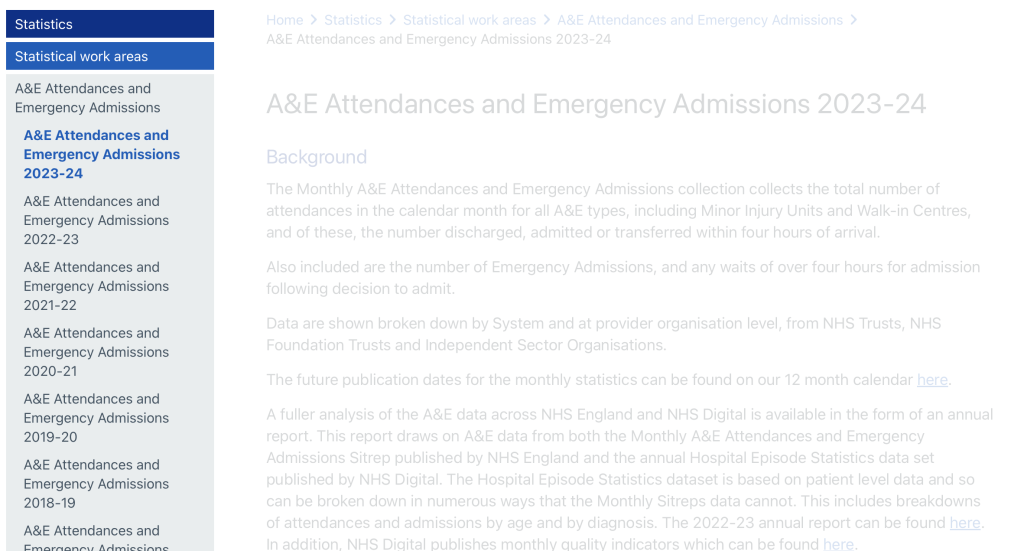
The data is indexed with a separate page for each fiscal year. For example, 'A&E Attendances and Emergency Admissions 2022-23' hosts individual monthly A&E data releases for April 2022-March 2023.
The first step in collecting and merging the data we need is to identify the URLs of the index pages where the monthly releases are hosted. In an ideal world, these URLs would be standardised but this is not the case. Instead we can collect the links by scraping them from the sidebar where they are listed.

We can extract the sidebar links we need by downloading the HTML source of the A&E stats homepage and then extracting all the links to the yearly index pages (e.g. "A&E Attendances and Emergency Admissions 2023-24"). In the code snippet below:
- Lines 1-2 declare the location of the A&E Stats homepage and download the contents of the page, storing the request in req.
- Line 3 parses the page contents with BeautifulSoup, creating a representation of the page that we can search through.
- Lines 4-5 find all the links on the page (by searching for instances of the HTML tag which denote links) and filters to only those linking to "A&E Attendances and Emergency Admissions" pages.
This yields us a list of every A&E stats index page, all the way from 2011 to 2024.
2. Batch Downloading Every Data Release
Now that we have a list of every A&E stats index page, we can automate the downloading of every Excel or CSV file they link to. Again, this is easily achievable in Python with BeautifulSoup and the built-in requests module.
For every index page (found in step 1), we every link and filter for just the links to Excel and CSV files. We then download these, one by one. Following this, we have roughly 500 sheets of A&E statistics for the years 2010-2024.


