This inaugural data-story explores using data from the American Community Survey (ACS), the US Census Bureau's annual demographics survey. It demonstrates accessing ACS data via the API, cleaning it, and visualising using Vega-lite. As a demonstration of the data's potential, we will work towards the creation of an interactive census-tract level (~4,000 people) map of incomes in, and around Chicago.
This guide assumes familiarity with APIs and Python, but no prior knowledge of the ACS is needed. It is not intended as a beginner's tutorial for Vega-Lite. Partial code excerpts are provided throughout and the full, commented notebook is available at ***.
Using the ACS API
Before you can start using the ACS API, we need to obtain an API key. This is a straightforward process:
- Visit the API key sign-up page: ACS API Key Sign-Up.
- Fill in the required information. The process is quick, free, and easy - we received a key in just minutes.
- Once you have your key, keep it secret.
The next step is to find identifying information (a series id, and codes for geography) for the data required. Conveniently, the Census Bureau hosts large tables of variables where it lists all series available. For example, the 2022 5 Year Edition's variables are available here (Detailed Tables).
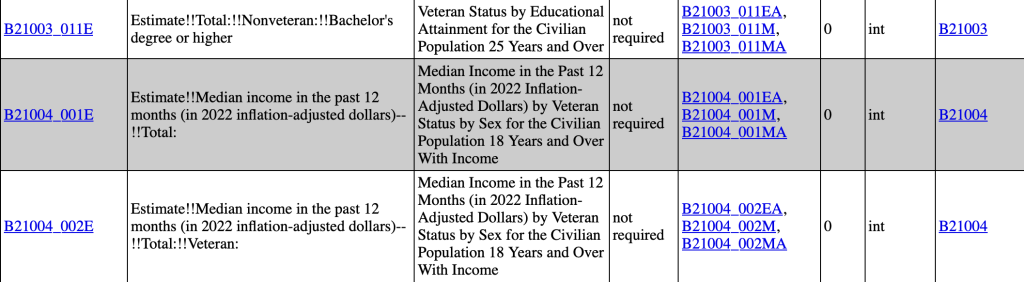
Searching the variable table for 'Median Income', we find series "B21004_001E" containing the annual median income for all earners. The series title refers to veteran status and sex but as we're not concerned about breaking down-our data further, we just choose the series ending 'Total:'; if instead, we wanted to present the incomes of veterans only, we could choose the next series, ending "Veteran".
As well as the series, we have to specify the geography for which we want results. A full list of supported geography is available on the ACS website. For our purposes, we want granular data for our map for which we'll use Census tracts, as well as county-level data. Across the US, there are over 70,000 Census tracts so we'll also have to specify that we only want data from Illinois (which we can find has code 17).
Having identified the series and geography we desire, we can put together API calls to request the data. ACS API urls take the form:
where we specify:
- The Year: Corresponding to an ACS release. Some years, notably 2020, are unavailable.
- The Dataset: This will always be acs/acs5 or acs/acs3.
- The Series: The id of the data we identified above.
- The Geography: We've specified that we're looking for all the tracts in every county in the state with the code 17 (Illinois).
Putting this all together, to request all the available Median Income data ("B21004_001E") at the census-tract level, we can loop through the years we require and store the responses in a list:
For data at the county-level, the process is the same, except we specify that we're looking for all counties within Illinois ("&for=county:*&in=state:17").
Cleaning ACS Data
We now have a list of data-frames each containing a year of ACS data. The next step is simple; we just have to merge and clean all the data. As we're just interested in the area in, and around, Chicago, the code below filters for just tracts in a few counties but this is a completely optional step.
The ACS returns nominal data so if instead we want real, inflation adjusted, incomes, we have to deflate the figures ourselves. Luckily, a Python module, EasyMoney, makes currency conversions and inflation adjustment easy. Using the function "ep.normalize" and specifying a year and currency, we can add a new column for 'Real Incomes'. Again, this is completely optional.
Visualising the Data
To map the income data we've extracted, we have to associate it with geographic data. The US census bureau offers shape files for every state (here) which can be converted to the .geoJson or .topoJson formats used online with tools like MapShaper (online), or QGis (free download).
Using Vega-lite, we can produce a simple cross-section with just a few lines of code. More complete guides exist but the basics are simple. We have to first upload our fetched data somewhere and associate the ACS data with the map data using a transform in Vega-lite.
To visualise our data, we just link to our income data:
  "data": {
    "url": "https://raw.githubusercontent.com/jhellingsdata/RADataHub/main/e4e/ch3_Work/data/chart3_8_Chicago_wards_incomes.json"
  },
associate it with the geographic regions, by linking the shapes of census tracts with incomes by their ID:
  "transform": [            {
              "lookup": "tract",
              "from": {
                "data": {
                  "url": "https://raw.githubusercontent.com/jhellingsdata/RADataHub/main/e4e/ch3_Work/data/chart3_8_chicago_tracts.topojson",
                  "format": {"type": "topojson", "feature": "chicago_tracts"}
                },
                "key": "properties.TRACTCE",
                "fields": ["properties", "type", "geometry"]
              }
            }
],
and specify a "geoshape" mark whose colour is defined by the income:
  "mark": "geoshape",
  "encoding": {
    "color": {
      "field": "Real Income",
      "legend": {"format": "$.0s"},
      "type": "quantitative"
    }
  }
Adding Interactivity
From this simple base, much more is possible. For example, by introducing an interactive parameter, we can filter the Choropleth map to a user-chosen year. This requires just two modifications to the simple example above. First, we must define a parameter to store the year selection.
  "params": [
    {
      "name": "year_select",
      "value": [2019],
      "bind": {
        "input": "range",
        "min": 2010,
        "max": 2021,
        "step": 1,
        "name": "Select year:"
      }
    }
  ],
Second, we simply apply a filter transform to filter the data to only the year chosen by the user.


