As economic activity slowed dramatically in the wake of Covid-19 and lockdowns, the world inadvertently moved towards meeting its objectives for limiting climate change. In the recovery, this progress is likely to be undone unless policy-makers act decisively.
Global energy demand dropped by 4% in 2020 – the largest fall since the Second World War (International Energy Agency, IEA, 2021). The world also experienced the first recession to register negative growth rates in all fossil fuels – with global oil demand falling by almost 10% – as well as the fastest increase in renewable energy sources as a share of electricity generation. These changes to global energy markets were a side effect of the pandemic and lockdowns.
Figure 1: Evolution of global GDP, total primary energy demand and energy related CO2 emissions, relative to 2019
Source: IEA Global Energy Review 2021
In comparison, before the pandemic, despite the 2015 Paris Climate Accord setting the world’s environmental goals to limit global warming to well below 2°C by 2050, greenhouse gas emissions reached a record high in 2019. This put the world on track for an average temperature rise of 3°C by 2050 (United Nations, 2020).
Ahead of the 26th United Nations (UN) Climate Change Conference (COP26) in November 2021, the appetite to take definitive action against climate change grew. This is especially true given the opportunity that the pandemic afforded citizens and governments to re-evaluate their objectives. As highlighted by the recent report from the UN Intergovernmental Panel on Climate Change and Figure 1 above, the period of recovery following the pandemic represents a significant opportunity for the world to move policy more decidedly in the direction of meeting the goals set in global climate agreements.
What happened to the energy mix in earlier recessions – 1975, 1982, 1991 and 2009?
The energy mix shows how the world meets its energy needs using various energy sources. This article focuses on commercially traded fossil and non-fossil fuels, as published in BP’s Statistical Review of World Energy 2021, grouping together fossil fuels (oil, natural gas, coal) and non-fossil fuels (nuclear, hydro, and modern renewables such as solar and wind).
The recessions of 1975, 1982 and 1991 all occurred immediately after a rise in the price of oil. The 1975 recession followed the 1973 oil price crisis resulting from oil embargoes by the Organization of the Petroleum Exporting Countries (OPEC). The 1982 recession came after the oil price rise in 1979, linked to the Iranian revolution and later the Iran-Iraq war. The 1991 recession followed the 1990 oil price shock, which was linked to the Iraqi invasion of Kuwait. These recessions have shaped the energy market, as the costs were not always borne equally by richer (OECD) and poorer (non-OECD) countries.
For example, OECD countries were affected most by the 1975 recession. In the aftermath of the crisis, world GDP grew at 1.5% and the effect on the global energy mix was short-lived. Figure 2 plots each fuel in the energy mix (stacked on top of each other) in exajoules (EJ, a unit of energy commonly used by industry experts). As shown, oil’s share in primary energy consumption dipped during the crisis but began to recover towards the end of the 1970s.
Figure 2: Primary energy consumption by fuel in exajoules (EJ)
Source: BP Statistical Review of World Energy, 2021
The 1982 recession affected the developed and developing world equally. It led to a slowdown in annual output growth to around 0.1% across the two groups of countries. During this recession, world primary energy consumption recorded negative growth (see Table 1), with oil consumption declining by over 3%, while non-fossil fuels experienced rapid growth.
In this sense, the 1982 recession solidified the decline in the share of oil that was precipitated by the 1973 crisis, particularly in richer OECD countries. To some extent, it triggered the beginning of the slow decline in the market share of oil consumption. That trend continues to this day: in the last 47 years since 1974, oil’s share in primary energy consumption in OECD countries has declined in all but seven years and since 2000, oil’s share has increased just once.
Table 1: Percentage change over previous year by fuel group in world recessions

Source: Authors’ calculations based on BP Statistical Review of World Energy, 2021
The 1991 recession resulted in a slowdown in consumption of all fuels, but only coal saw negative growth rates in the world as a whole (see Table 1). Table 2 indicates that this recession had greater effects on non-OECD countries, which experienced growth rates in all fuels further below their long-run averages than in their OECD counterparts.
Table 2: Percentage Change over Previous Year by Fuel Group in World Recessions, OECD and non-OECD
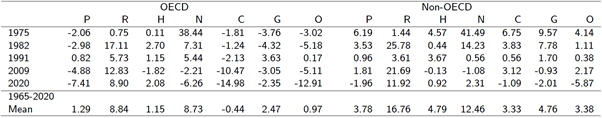
Source: Authors’ calculations based on BP Statistical Review of World Energy, 2021
Note: P: primary, R: renewables, H: hydro, N: nuclear, C: coal, G: gas, O: oil
The 2009 recession, resulting from the global financial crisis of 2007-09, differs from its predecessors for one fundamental reason: it did not follow a supply-induced oil price hike and was an aggregate demand shock. It followed the 2008 sub-prime mortgage crisis in the United States along with ensuing spikes in unemployment and a consumer credit squeeze.
This recession affected almost all fuels, as demonstrated by the negative growth rates in Table 1, which is also visible in Figure 2 as a temporary dip. Only renewables continued to grow and encouragingly, they grew at a level above their long-term average despite the deep recession experienced around the world.
This was one of the few recessions in which global energy consumption fell (see Table 1). But it affected the world unequally: although primary energy consumption declined in OECD countries, it still recorded positive – albeit reduced – growth in non-OECD countries (see Table 2). This implies that the fall in OECD energy consumption was pronounced enough for energy consumption to decline globally.
How is the 2020 recession different?
The Covid-19 era constituted the largest decline in primary energy consumption since the Second World War, falling by over 4%. This represents more than two and a half times the decline seen in the 2009 recession and over six times the decline of the 1991 recession.
Falls attributed to the pandemic are concentrated in fossil fuel consumption, with unprecedented global declines of 3%, 4% and over 9% in coal, natural gas, and oil consumption, respectively (Figure 2 and Table 1).
This is the first economic shock since the Second World War to affect primary energy consumption negatively in non-OECD countries (see Table 2). It is also the first recession in which all fossil fuels recorded negative growth rates in non-OECD countries.
Perhaps unsurprisingly, jet fuel and gasoline demand plummeted as planes were grounded and lockdowns took effect around the world. It is also notable that renewables enjoyed growth rates near their long-term averages in both OECD and non-OECD countries. This represents a degree of convergence towards Paris Agreement climate targets not seen previously.
After Covid-19, where do we stand vis-à-vis climate objectives?
The fall in energy demand was also reflected in carbon emissions. Global carbon emissions from energy use fell by 6.3% in 2020. This is roughly in line with the UN Emissions Gap Report 2020, which predicted a decline in total carbon emissions in 2020 of 7% due to the pandemic. Note here that we differentiate between carbon emissions from energy use and total emissions. This is because although energy use accounts for the majority of carbon emissions, other industries – most notably agriculture – also play a role.
While this fall in carbon emissions is vast by historical standards, the UN report also noted that the world will need to reduce total greenhouse gas emissions by 7.6% a year for the next ten years in order to meet the Paris Agreement’s goals on climate change (UN, 2020).
This puts into context the scale of change needed: it took a severe global recession leading to unparalleled reductions in energy and non-energy consumption to reduce carbon emissions sufficiently. The undesired outcome of the pandemic was its economic impact, with the world economy contracting by 3.4% in 2020.
To place this in relation to the 2°C target, Figure 3 plots global carbon emissions from energy use through to 2030. It uses the 2019-20 growth rate to demonstrate where we would be if we lived as we did in 2020 for the rest of the decade. Using the IEA’s World Energy Outlook as a basis, we see that by 2030, carbon emissions from energy use would be well below the level required to stay within the 2°C target.
Figure 3: Global carbon emissions from energy use
Source: Authors’ calculations, BP Statistical Review of World Energy 2021, and IEA World Energy Outlook 2021
Note: Data from 2021 onwards uses the 2019-20 growth rate to interpolate the path to 2030. The IEA’s World Energy Outlook 2020 Sustainable Development Scenario is used as a basis for comparison in 2030. This scenario is largely in line with the 2°C target.
This is quite a positive message, and the desired level of emissions seems within reach by 2030. The missing piece of the puzzle is the composition of emissions. Composition matters because different fuels have different carbon contents. This has a direct impact on the amount of carbon emitted when each of these fuels is combusted. For example, some types of coal emit twice as much carbon as natural gas per unit of energy produced.
As such, it is, in principle, possible to reduce emissions without curbing total energy consumption. This could be achieved by replacing coal with natural gas or, better yet, non-fossil fuels. Within fossil fuels, coal is the most carbon-intensive and natural gas the least. Oil ranks in the middle, and various products derived from crude oil have their own carbon intensities.
Continuing the hypothetical exercise above where we sustain 2020 trends until 2030, Figure 3 shows how the energy mix would evolve over the years. Although arguably unrealistic because this exercise assumes a continuous decline in global primary energy consumption, there are some useful messages here:
- First, we need non-fossil fuels to continue to grow at a rapid pace.
- Second, replacing coal with cleaner fossil fuels or non-fossil fuels would provide the energy we require without the emissions.
Figure 4: Global energy mix by fuel, 2021 onwards estimated using 2019-20 growth rates
Source: Authors’ calculations based on BP Statistical Review of World Energy 2021
What does the post-Covid-19 recovery look like?
Carbon savings realised in 2020 came mostly from the fall in oil consumption, as lockdowns, home working and less air travel meant lower carbon emissions. These changes are particularly notable in a year with such low oil prices. In 2020, the oil price was significantly lower than its five-year historical average (see ‘WTI’ compared with ‘5yr WTI’ in Table 1).
Moving forward, the transport sector is key. To highlight this point, Figure 4 shows the sectoral contribution to primary energy consumption growth in 2020 calculated using the IEA’s sectoral shares. Although transport accounted for approximately 33% of primary energy consumption during 2020, Figure 5 shows that this sector contributed over half of the fall seen in primary energy consumption. This reaffirms the importance of this sector in reaching climate objectives and therefore in appropriate policy responses.
Figure 5: Sectoral contribution to primary energy consumption growth in 2020
Source: Authors’ calculations based on BP Statistical Review of World Energy 2021 and IEA World Energy Outlook 2020
Note: The figure represents the primary energy growth in 2020 of -4.38%. In other words, the whole ‘pie’ corresponds to the -4.38% change in primary energy growth. Displayed figures are percentage contribution of each sector towards this.
The quick rise of oil prices from the depths of negative prices in 2020 indicates that oil demand may be returning to pre-pandemic levels. While rising prices are bad news for consumers in the short run, a high oil price can incentivise investments in renewables in the longer term.
But this is a complex relationship. Links between oil price and the energy mix have been weakening since the 2009 recession and the shale revolution in the United States. Due to the differences in technology required for hydraulic fracturing (fracking), producers have been able to adjust production rapidly in response to the oil price (Ersoy and Schaffer, 2020).
This has placed a ceiling on the price of oil and, to a certain extent, reduced the ability of OPEC to influence it. Since a low oil price, and thus cheap energy, tends to slow down the adoption of non-fossil alternatives, this price ceiling could limit the growth rate of non-fossil energy.
Nevertheless, renewable energy consumption growth has carried on apace in 2020. This is at least partially because investment in renewables is now driven more by national policies and long-term commitments, including the Paris Agreement, along with a growing appetite to switch away from fossil fuels.
Cost reductions have also played an important part in the growth of renewables. Hydropower, solar and wind are already cost-competitive against fossil fuel power generation in several countries. This continues to encourage governments, firms and households to invest in them. The trend is likely to continue with technological progress. Since efficiency gains in fossil fuel technology have already been largely exploited, the scales are likely to tip in favour of non-fossil fuels in the coming decades. Similar patterns had been visible in the data before now, and the all-important question has always been whether the switch would take place sufficiently quickly.
What should we expect after COP26?
While the most recent Intergovernmental Panel on Climate Change (IPCC) report (IPCC, 2021) paints a dire view of the situation, there were significant opportunities for progress at COP26. Economics establishes that we suffer from ‘ambiguity aversion’: we are not very good at taking action when risks are uncertain. But the IPCC has now made its most concrete statement that humans are ‘unequivocally’ causing climate change.
This is a statement that is borne out of multiple lines of evidence – from lived experience as well as from climate change models. In 2020 alone, we saw unprecedented extreme weather events: flooding in Germany, wildfires in Greece, Turkey and the United States. As the IPCC report notes, the costs of climate change are being witnessed all over the world. Climate change is no longer a poor-country issue; rich countries are also seeing the costs first-hand.
Such an even distribution of costs augured well for COP26, since when costs are distributed evenly, international cooperation is more likely. This was pivotal in the resolution of a previous global crisis that required international cooperation: the hole in the ozone layer, which was created by emissions of chlorofluorocarbons (Chick, 2019).
A drastic change to the global energy mix is required to achieve climate goals, including countries committing voluntarily to strand fossil fuel assets, such as discovered oil reservoirs, oil rigs and related fossil fuel infrastructure (McGlade and Ekins 2014, 2015). This puts an additional burden on non-OECD countries, as their economic development would benefit from extracting these resources.
With the correct set of policies, which recognise the inequality inherent between OECD and non-OECD countries in abatement costs, the world may make significant progress towards a more sustainable path for growth.
As far as carbon emissions are concerned, the effects of the pandemic are as close to time travel as we can get. Carbon emissions in 2020 were back to their 2011 levels. If we were back in 2011 today, would we have done anything differently? The world expected a satisfactory answer to this question from COP26. After all, we are wiser today than we were back in 2011. Yet the commitments in Glasgow were lacklustre. The pledges may bring us closer to climate goals, but there is much more to be done – especially as the world’s focus is now on post-pandemic economic recovery. As highlighted in Figure 1, early forecasts already show global energy demand bouncing back in 2021 and surpassing pre-Covid-19 levels (IEA, 2021). If realised, this would bring carbon emissions back up and we may well find ourselves back where we started.
Where can I find out more?
- The Economy by the CORE Team includes a discussion of the trade-off between abatement and current consumption of goods and services (see Unit 20 in particular).
- Historical statistics and analysis available on BP’s Statistical Review of World Energy website.
- The International Energy Agency’s World Energy Outlook has extensive analysis of multiple scenarios.
- UN Emissions Gap Report provides an annual update on the differences between greenhouse gas emissions and their desired levels to avoid the worst impacts of climate change.
- The Intergovernmental Panel on Climate Change has countless valuable resources, including the first part of the Sixth Assessment Report entitled Climate Change 2021: The Physical Science Basis.
Who are experts on this question?
- Erkal Ersoy
- Rachel Forshaw
- Mark Schaffer
- Dieter Helm
- David Newbery