The UK government’s strategy for supporting incomes in the crisis rests on the Coronavirus Job Retention Scheme, the Self-Employment Income Support Scheme and the social security system, mainly Universal Credit. What do we know about their effectiveness in protecting the vulnerable?
The UK government’s response to the need to support family incomes directly during the crisis has been unprecedented. Estimates by the Office for Budget Responsibility (OBR) put the total estimated cost (including the Coronavirus Job Retention Scheme) at around £68.5 billion.
These measures have been very effective at protecting workers who have been furloughed, some of the self-employed and those who can claim Universal Credit (UC). Those who have lost their job or businesses but cannot claim UC – whether because they have high levels of saving, they have a partner with high earnings, or they have ‘no recourse to public funds’ because of their migration status – will be facing large falls in income.
What measures have been introduced?
In the months following the crisis, the UK government’s strategy for supporting family incomes has rested on the Coronavirus Job Retention Scheme (CJRS) for those employees whose work has disappeared but who are not made redundant; the Self-Employment Income Support Scheme (SISS) for those self-employed who qualify; and the social security system (mainly UC) for everyone else. In addition, the government has announced major changes to the social security system that will increase the value of UC, the Working Tax Credit and Local Housing Allowance.
At the time of announcing the measures, the government said that the boost to social security benefits and tax credits would apply only during the 2020/21 financial year, and that they would cost £7 billion this year. This figure has since been revised up to £8 billion by the OBR in light of the rise in the numbers claiming benefits.
There have also been some fairly technical changes to the social security system that help the self-employed, including the abolition of the minimum income floor in UC (which should increase the amount that very low income self-employed can claim), and the removal of the seven-day waiting period that restricted the self-employed ability to get some allowances related to sick pay. There has also been an increase in the money given by central government to local government to provide help with council tax bills and to enhance local welfare provision.
We do not yet have a thorough assessment of the impact of all these measures on the distribution of income. But we can say something by thinking about what the design of the scheme says about the sort of people who might benefit. Let’s consider them in turn:
- Broadly speaking, the CJRS will benefit those employees whose employers furloughed them. Lower-paid workers were more likely to be put on furlough than higher-paid workers (they were also more likely to be made unemployed), so this has benefited the low paid more directly (Gardiner and Slaughter, 2020). People who had not been entered onto employers’ payroll by 19 March 2020 definitely missed out.
- The SISS will benefit all those self-employed who have earned less than £50,000 a year in the years leading up to the crisis. But those who are newly self-employed (and did not file a self-employment tax return in the past three years) are not able to claim this benefit.
- The increased benefit spending will help those who were receiving UC or tax credits before the crisis, as well as the newly unemployed or those whose earnings have fallen who go on to claim UC. The increase in benefits is targeted towards the poorest. There will be some people who lose their job who are not able to access UC, because they have savings of £16,000 or more, or because they have a partner whose earnings is high enough to move them outside the means test. They would not receive the £20 a week emergency coronavirus boost. There are also workers in the UK who are not able to claim any social security benefits at all because of their country of birth or migration status.
We know a little more about the beneficiaries of the additional benefit spending. The figure below shows how the changes affect disposable incomes, on average, across the income distribution. Disposable incomes in the bottom quarter of the income distribution rise by just under 5%, and 59% of the rise in UC spending goes to households in this group (Brewer and Gardiner, 2020).
Figure 1: Impact of changes to Universal Credit and tax credits announced in the Chancellor's 20 March coronavirus package on net household income (after housing costs): UK, 2020-21
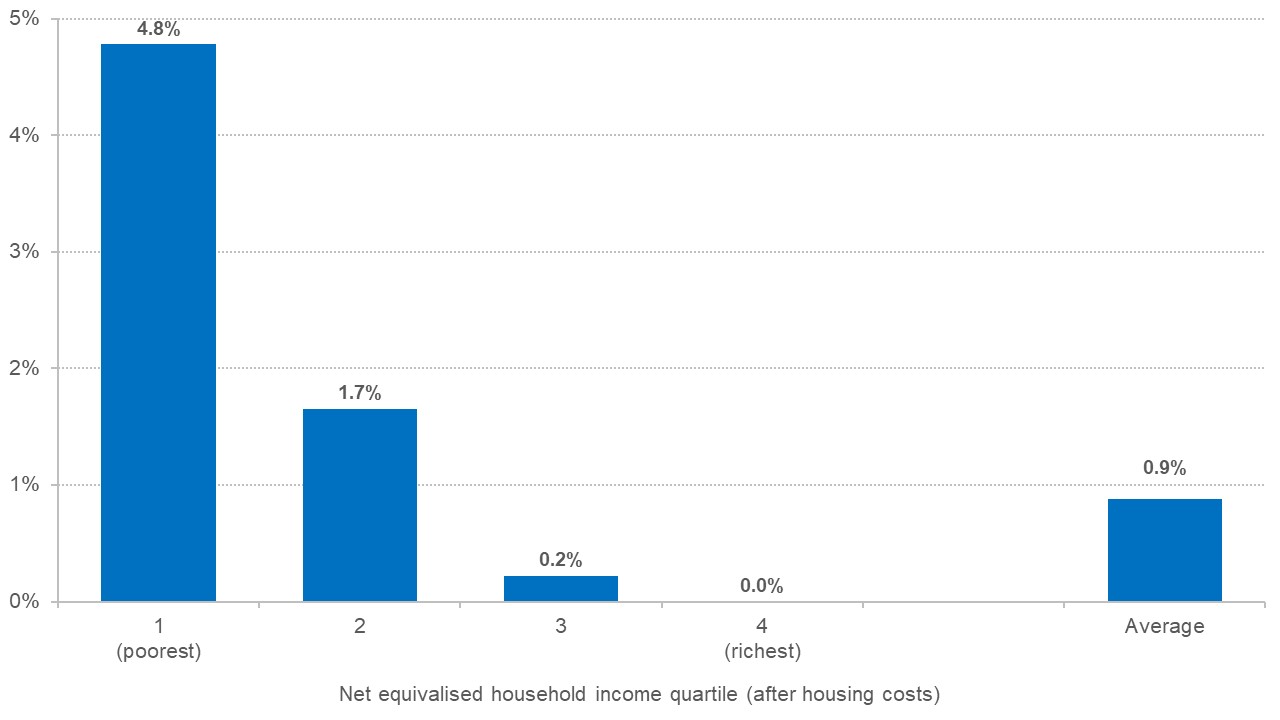
Notes: Assumes partial roll-out of UC, and accounts for benefit take-up. Assumes 2017-18 levels of earnings and unemployment. Modelling include changes to Universal Credit and tax credit allowances, and the Universal Credit minimum income floor for the self-employed. Changes to Local Housing Allowance rates are not included, but can be assumed to have a similar impact across the distribution.
Source: Resolution Foundation analysis using the IPPR tax-benefit model.
And we know a little bit about how systems are holding up in practice (and experience from some US states shows the hardship and health risks that can arise when systems are unable to cope with high claimant inflows). Claims for UC have surged since the crisis began: the Department of Work and Pension's management information systems recorded 2.6 million claims for UC in eight weeks. The number of excess new starts on UC in the first four weeks of the crisis is equivalent to the number of excess Jobseeker’s Allowance claims over the first nine months of the previous recession.
Despite this surge, over 90% of payments due were paid in full and on time, and the vast majority of advance payments are paid with 72 hours. One report shows that 74% of new UC claimants reported they were satisfied with the way DWP handled their claim (Brewer and Handscomb, 2020). But it’s clear that for some, the move to UC represents a significant shock to living standards. Although new UC claimants have, on average, higher earnings and more savings than existing benefit recipients, 36% are having trouble keeping up with bill payments, 42% have cut back on spending to prioritise housing costs, and over half have already dipped into their savings (Brewer and Handscomb, 2020). They are also more likely to face high housing costs due to renting in the private sector.
There is a great deal of focus on how long the CJRS should continue for, and at what level of generosity. The CJRS is generous in comparison with UC: under the CJRS, the median fall in disposable income if someone is moved to 80% of their past earnings is just 9%; but that figure is 47% if people instead lose their jobs and fall on to UC (Brewer and Handscomb, 2020). As well as raising questions of fairness, this means that, as the CJRS scheme is reformed during the second half of this year, any workers who are then made redundant may experience large falls in their family income.
What effects on poverty and inequality?
A wider question is what the overall impact of the crisis is likely to be on measures of poverty, or on inequality. Again, it is too soon to say. High-quality data on household incomes, of the sort that is used to estimate income inequality and rates of relative poverty, tends to be released with long lags.
For example, the two most important estimates of the level and distribution of household living standards in the UK both tend to be published 11 months after the financial year spanned by the data (these are the Department of Work and Pension's ‘Households Below Average Income’ publication, and the Office for National Statistics release on household income inequality ). This means that official estimates of income poverty and inequality for the current financial year, 2020/21, won’t be available until March 2022.
Because of these very large lags, in recent years, researchers have developed a technique to estimate poverty and inequality at the current moment (see, for example, Navicke et al, 2014). This is called ‘nowcasting’ and uses real-time information on how the economy and the labour market are evolving, together with detailed data on the distribution of income in the past, to estimate what is happening to the distribution of income right now. The precise details can vary between studies, are the results are heavily dependent on the methods used and the assumptions made.
So far, there are no published estimates based on nowcasting of how the crisis has changed the UK income distribution or affected poverty rates. But several exercises are currently being carried out within central and devolved government, at thinktanks (for example, at The Resolution Foundation), and within universities (for example, at the Institute for Social and Economic Research at the University of Essex).
We also know a little bit about the distributional impact of the impact of the crisis on the labour market. At the time of writing, the official data on the state of the labour market provided only the headline figures: the claimant count measure of unemployment-related benefit recipients jumped by 850,000 in April to hit 2.1 million, already 0.5 million higher than in the depths of the recession that followed the 2008/09 global financial crisis, and early evidence from HM Revenue and Customs suggest that employment fell by 450,000 in April.
We can learn more from various independent online surveys. For example, analysis of data from late March reports that instances where people have made unemployed since the crisis began are related to previous earnings, to age, and to the type of employment contract, with the risk of unemployment being greater for the low paid, for the young, and for those in non-standard occupations (Adams-Prassl et al, 2020).
Two other reports on data collected at the end of April, find similarly (Gardiner and Slaughter, 2020; and Gustaffson, 2020). Of course, the crisis does not mean that all low-paid workers are at risk of unemployment, as many of the designated key workers are in fact low-paid. But this strongly suggests that the labour market shock has hit the lower earners much harder than the better off.
Looking back at past crises and recessions, a summary of the research evidence just after the financial crisis concluded that there is ‘a reasonably clear answer as to which groups’ living standards are likely to be most cyclical, and hence worst affected by recessions – we expect to see strong effects of recessions on the incomes of working-age individuals, but weaker effects on individuals who are retired or who are not strongly attached to the labour force.’ (Muriel and Sibieta, 2009)
Indicators of absolute poverty (that is, using a poverty threshold that is just updated each year with inflation) increased in all three of these recessions, particularly for children (Muriel and Sibieta, 2009). This is what most people would predict: during recessions and crises, living standards fall.
Measures of relative poverty – defined as living in a household with less than 60% of median income – fell in the UK recessions of the mid-1970s, the early 1980s and the early 1990s. These falls were driven by large reductions in pensioner poverty: because pensioners get most of their income from sources other than the labour market, they tend to move up the income distribution when unemployment rises and earnings from the labour market fall, and this reduces relative measures of poverty.
We can also surmise that those above working-age will be less affected, in financial terms, by the current crisis than those of working-age. Lower-income people over the pension age in UK get the majority of their income from the government in social security benefits. And although asset prices have fallen and interest rates are very low (both of which tend to reduce the income that people can get from their investments or private pensions), this crisis is not rooted in the financial markets, as was the recession after the global financial crisis.
Indeed, one study points out the those aged 65 or over before the crisis devoted 29% of their spending on activities that were heavily or entirely stopped because of the UK’s lockdown (specifically `restaurants and hotels’, and `recreation and culture’), a higher proportion than all other age groups, and so some may find themselves spending much less on an unchanged income (Rahman, 2020).
In the recession that followed the global financial crisis, relative poverty fell very slightly from 2007/08 to 2012/13, although this hides falls among pensioners and rises among other groups. Absolute poverty, hardly changed from 2007/08 to 2010/11, but then started to rise in 2011/12, especially for children and the working age, due to the austerity measures that followed, reminding us that the policy responses to crises determine the impact on the vulnerable as much as the initial economic shock.
That will be true to an even greater extent in the current recession, as the nature of the public health response by necessity means a much greater role for the state in determining what economic activities can and cannot go ahead, as well as in introducing new policies or reforming old ones to help cushion the shock to household incomes.
Where can I find out more?
Income protection for the self-employed and employees during the coronavirus crisis: Stuart Adam and colleagues from the Institute for Fiscal Studies analyse the Job Retention Scheme and the Self-Employment Income Support Scheme.
Inequality in the Impact of the Coronavirus Shock: New Survey Evidence for the UK: Abigail Adams-Prassl and co-authors show how the unemployment shock in the UK affects those of different ages, different earnings levels, and different employment contract types.
This time is different – Universal Credit’s first recession: assessing the welfare system and its effect on living standards during the coronavirus epidemic: Mike Brewer and Karl Handscomb analyse how Universal Credit has coped so far in the coronavirus crisis, and how the new UC claimants are coping with it.
Young workers in the coronavirus crisis: Findings from the Resolution Foundation’s coronavirus survey: Maja Gustafsson reports on how workers of different age are affected by the labour market shock brought about by the coronavirus, including their experience of redundancy, furloughing, earnings loss, as well as in their ability to work from home.
Business shuts down it hurts those just above the poverty line most: Chicago Booth Review reports on evidence from the last recession in the United States.
The Covid-19 Crisis Response Helps the Poor: read the analysis by researchers at iSER on the distributional and budgetary consequences of the UK lock-down.
Who are UK experts on this question?
- Abigail Adams-Prassl, Associate Professor, University of Oxford
- Mike Brewer, Chief Economist, The Resolution Foundation
- Robert Joyce, Institute for Fiscal Studies