Leaving the European Union has undoubtedly had effects on the UK economy. The most obvious ones will be on international trade. But Brexit might also have an impact on business investment, which is crucial for the economy to grow.
In the years after the referendum on membership of the European Union (EU) in mid-2016, business investment in the UK was essentially flat. It then took a sharp hit during the Covid-19 pandemic, and has recovered slowly, only just regaining its pre-pandemic level at the end of 2022. A range of analytical approaches suggest that business investment has been subdued partly due to the effects of Brexit, and this will have reduced the size of the economy and future growth.
What is business investment and why is it important?
There are two broad ways of growing the economy: using more inputs or using inputs more efficiently. The two main inputs are labour (workers and hours worked) and capital assets (buildings, machines and ideas). How efficiently labour and capital are combined is productivity (or more formally, total factor productivity).
Capital used in the economy is the outcome of investment. Each year, firms invest in new assets and major repairs and improvements to existing assets, which builds up their capital stock. But each year, capital also depreciates as it ages and wears out. So the total stock of capital available depends on current and past investment, net of depreciation.
Business investment, as measured by the Office for National Statistics (ONS), covers investment by businesses in buildings, structures, ICT (information and communications technology) equipment, machinery, vehicles, software, research and development (R&D) and other smaller categories. It excludes investment by government, and investment in housing, although those are included in a measure of total investment in the national accounts. So business investment is the flow of new capital assets that workers can use in business production.
How can we tell if Brexit affected business investment?
To understand how Brexit has affected business investment in the UK, we need to know what would have happened if the UK hadn’t voted to leave the EU in mid-2016 – that is, what is the counterfactual? Of course, we cannot know that for sure. But we can use a few methods to get a good sense.
A simple first approach is to observe that the growth of business investment fell sharply from the middle of 2016 onwards, right from the point of the referendum. This can be seen clearly in Figure 1, which shows the level of UK business investment in every quarter from the start of 1997 to the end of 2022, adjusted for inflation over time. Business investment had been growing at about 6% per year (1.5% per quarter) between 2011 and 2016, but was flat between 2016 and 2019.
Figure 1: Business investment outturn and counterfactual, constant prices, seasonally adjusted, UK
Source: ONS, authors’ calculations
So what counterfactual shall we use to calculate the effects of Brexit? The growth between 2011 and 2016 was unusually fast, and unlikely to persist forever. Using that rate of growth as our counterfactual would thus not be appropriate.
Instead, we can use a longer-term average growth rate of 0.5% per quarter, which is roughly the rate if averaging from 1997 to 2016. But we also need to account for the effects of the pandemic, which caused a sharp decline and rebound in business investment, an outcome that is most likely to have happened even in the absence of Brexit.
Therefore, the dashed line in Figure 1 shows our counterfactual level of business investment, which comprises an assumed growth rate of 0.5% per quarter (consistent with the long-term average) but matches the profile over the pandemic in the official data. This is based on work we shared on Twitter in February 2023, and was the basis for some comments in a recent interview. Our estimate indicates that business investment was about 10% less than it would have been absent Brexit in 2022.
Are there other approaches to measuring the counterfactual?
How reasonable is this counterfactual? A more complicated approach is to use the data for other countries, which of course did not vote for Brexit in 2016. While all countries are unique, major economies often share patterns of growth in key economic variables.
John Springford for the Centre for European Reform conducts a ‘doppelgänger’ analysis to explore the costs of Brexit. This analysis uses statistical techniques to find the best combination of other countries that match a range of economic variables for the UK before the referendum, and uses this same combination to project what might have happened thereafter. The input data cover 22 other advanced economies, and the algorithm aims to match data on a range of variables, including economic growth, inflation, investment and trade.
Using this method, John estimates a doppelgänger of investment (total investment, not just business investment), which (see Figure 2) looks remarkably similar to our counterfactual from Figure 1. The doppelgänger grows at about 1% per quarter between 2016 and 2019, and also exhibits a decline and rebound during the pandemic. He estimates that the UK shortfall in total investment in the second quarter of 2022 is 11%, remarkably close to our 10% for business investment for the same period.
Figure 2: Doppelgänger analysis of total investment after the EU referendum
Source: John Springford for CER
A complementary but simpler approach is simply to take an average of the rest of the G7 group of countries – Germany, France, Italy, the United States, Canada and Japan. These are six major economies, similar to the UK in some ways, and the most obvious comparators to the UK in many respects.
This is in the spirit of the doppelgänger analysis, but less statistically sophisticated, although perhaps somewhat more transparent. A simple average of the quarterly growth rate of business investment of these six countries, over the period 2016 Q4 to 2019 Q4, is 0.8%. Restricting to just Germany, France and Italy (the European members of the G7), and the average rises to 0.9% per quarter. These are both stronger than our assumption of 0.5% growth per quarter, which suggests we may even be underestimating the counterfactual.
Researchers at the Bank of England and elsewhere, using a large survey of business in the UK, also made an estimate of the impact of Brexit on business investment (Bunn et al, 2021). Based on responses from businesses, they estimate that business investment was 23% lower than it would have been in 2020/21 due to Brexit.
Figure 3: Comparison of business investment across G7 countries, constant prices, seasonally adjusted, index 2016 = 100
Source: ONS, Destatis, OECD, Eurostat, US BEA, Statistics Canada, Japan Cabinet Office, istat, authors’ calculations.
Notes: Business investment is a measure published by ONS for the UK, and not an internationally agreed measure. We approximate business investment for the other countries of the G7 using available data. For the US, Japan, Canada and Germany, a very similar series is readily available. For France and Italy we construct our own measure by removing housing investment and government investment from total investment. Please contact josh.martin@bankofengland.co.uk for more details.
Is the slowdown in UK business investment growth due to any particular industries?
It is also instructive to consider how investment has changed in different industries. If the slowdown in business investment growth in the UK were limited to a single industry – North Sea oil, for example – then that might be due to reasons other than Brexit.
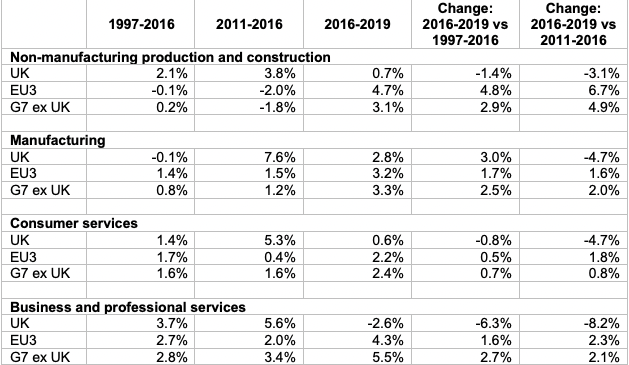
Table 1 shows the average annual growth rates of investment in four broad industry groups, before and after the referendum in 2016, for the UK and comparator country groups. In all industry groups, the UK saw slower investment growth after 2016 than the rest of the G7, and a slowdown relative to the preceding years. The business services industry grouping (comprising transport, ICT services, finance, and professional and administrative services) appears to see the sharpest slowdown.
Since the slowdown in investment growth in the UK appears to cut across industries, it seems likely to be related to Brexit. To the extent that different industries are more important to different regions of the UK, this might also have implications for the regional impact of Brexit on the UK.
Table 1: Average annual growth rates of investment by industry group, UK and comparator country groups
Source: OECD, authors’ calculations
Notes: Industry groups based on aggregations of industry codes – Non-manufacturing production and construction = ABDEF, Manufacturing = C, Consumer services = GIRS, Business and professional services = HJKMN. Consistent with business investment, real estate and government services industries omitted. Growth rates are compound average annual growth rates in year ranges (inclusive), e.g. the figure for 1997-2016 is investment in 2016 over investment in 1997, to the power of one over 19. EU3 = Germany, France and Italy. Country groups are simple averages of country growth rates.
What are the implications of weaker business investment?
So what? How does weaker business investment translate into consequences for the economy at large? The stock of capital used in the economy is enormous, as a consequence of investment over decades (think of museums, football stadia and airports, for example). So how much difference can slightly slower investment make?
The answer is that sustained slow investment can make a difference. Following normal statistical practice, we can cumulate our counterfactual business investment series to obtain a counterfactual estimate of the capital stock. Where in the official data, the capital stock rises by about 4% between mid-2016 and the end of 2022, our counterfactual measure rises by about 9%.
We can translate the slower growth in the capital stock into effects on GDP using standard economic models and understanding, which suggest that every 3% increase in the capital stocks yields a 1% increase in GDP. So, this exercise suggests that GDP would be 1.3% higher in 2022 if it had seen the extra business investment in our counterfactual. That extra 1.3% of GDP is equivalent to £29 billion. Spread across about 28 million households in the UK, that is equivalent to about £1,000 per household in 2022.
Of course, it seems rather unlikely that every household would be equally better off by £1,000 in this scenario, but the country would be richer to the tune of £29 billion, and the government and society would be able to do with that as they saw fit. It is worth noting that GDP is what the country produces every year, so this analysis suggests that the UK is worse off by £29 billion every year, and that figure would grow over time unless business investment recovers to where it would have been.
Finally, how do these results fit with other estimates of the impact of Brexit on the economy? The Office for Budget Responsibility (OBR) estimates a decline in the level of UK productivity of about 4% by the end of the 2020s, based on a decline in imports and exports of around 15% (the relation between trade and productivity is summarised by the OBR here). The Treasury and Bank of England have similar figures.
Who are experts on this question?
- Jonathan Haskel
- John Springford
- Swati Dhingra
Where can I find out more?
- Latest ONS data on business investment.
- Latest post from John Springford for the Centre for European Reform on ‘The cost of Brexit’.
- Paper using data from the Decision Maker’s Panel (DMP) on the firm-level impacts of Brexit on business investment.