How can we keep track of consumer prices when visits to shops to collect data are not currently possible, when many items in the ‘shopping basket’ are not being trading – haircuts, restaurant meals and such like – and when patterns of spending have changed so much?
The pandemic started to have a major impact on the economy in mid-March and has raised major issues about the production of the inflation statistics:
- First, there is the practical one: the physical collection of prices by agents visiting shops is no longer possible.
- Second, there is a conceptual one: many services such as hairdressers, restaurants and some goods are not available, and so have no prices to be collected.
- Third, the patterns of spending are completely different. The overall level of expenditure started to fall in March and the pattern of expenditure changed: even though some types of good are still available, we simply spent less on them.
The expenditure weights used to construct CPIH (today’s headline measure of consumer price inflation) are based on expenditures in previous years. In the UK, we normally spend quite a lot on recreation and culture (including going to cinemas, theatres, sports events and live music venues), restaurants and hotels, air travel and holidays. Not so during the lockdown.
What are the challenges of measuring inflation in lockdown?
There is a tried and tested method for compiling the inflation figures that has been developed since the Second World War. National statistics institutes across the world collect thousands of prices across many categories of consumer goods and services. These are then combined: averages are taken across each item (particular types of good or service) and then these averages are combined using expenditure shares to get the aggregate figure, which is published as headline inflation. This is done each month in the UK, where over 180,000 prices are collected across over 700 items in the ‘shopping basket’.
The inflation figures for March 2020 were published as normal: the collection of prices occurs early in the month and was largely unaffected by the pandemic. Of course, expenditure was already being affected in the second half of the month: the government lockdown started on 24 March, but households were already changing their behaviour and cancelling hotel stays and trips to the restaurant in the preceding weeks.
The Office for National Statistics (ONS) calculated the CPIH inflation for March using the standard expenditure weights and published the figure 1.5% on 22 April. What would the figure have been if the expenditure shares had been altered to reflect the changes in consumer behaviour? Clearly, prices for types of goods and services behave differently. In recent years, clothing and footwear have low or even negative inflation, restaurants and hotels have seen higher inflation. Changes in expenditure shares can increase or reduce inflation.
In a recent study, guesstimates of the lockdown expenditure shares were applied to the March price data to generate a ‘lockdown-weighted’ inflation measure, CPILW (Dixon, 2020). This found that the overall effect of changing expenditure shares was to increase inflation slightly: CPILW was 1.8% (0.3% higher than CPIH).
How does the ONS plan to measure inflation during the pandemic?
How was the figure of 0.9% CPIH inflation for April calculated? The ONS has published its plans for measuring inflation during the pandemic (ONS, 2020a). This consists of four main strands:
- First, after due consultation, the ONS has decided that about 90 items out of the usual 700 are unavailable during the lockdown. These items include restaurant meals, air tickets, hotels, personal services, pints in the pub and so on. Together, these items represent about 16.3% of expenditure in CPIH, 20% for CPI (which excludes imputed rent).
- Second, for the remaining ‘available’ items, the collection of prices will be exclusively online or by phone.
- Third, the behaviour of the prices for unavailable items will be assumed to be the same as for the rest of the (available) items. This is described as ‘imputation’ of unavailable prices using available prices.
- Lastly, all items (available or unavailable) will be assumed to have the usual expenditure shares. In deciding this course of action, the ONS has clearly stated that it is abiding by the standard conventions (which come from Eurostat and the United Nations) and something similar is being done in other countries.
The first point to make is that the imputation of unavailable prices is equivalent to altering expenditure shares. If you use the ‘available prices’ to impute the unavailable prices, you are effectively increasing the weight of the available prices in the price index.
Assume your price index for apples and oranges is the 50:50 average of the two prices. Now assume that oranges are unavailable and you ‘impute’ the price of the oranges form the price of apples. In effect, the index now depends 100% on the price of apples and it is as if you have reweighted the shares to 100:0. If the unavailable goods represent 16.3% of the CPIH weight, then the remaining 83.7% gets reweighted to 100%.
The key point to note is that the relative weights of the available items remain unchanged: they all get a bit bigger – multiplied by a factor or 1.2 so they add up to 100%.
How do consumer spending patterns change under lockdown?
The patterns of expenditure during the lockdown are very different to those implied by the ONS method. While it has eliminated those items that are unavailable, it does not allow for the reduction in expenditure on items that are available but for which consumption has fallen. For example, petrol is an item that is available, but petrol consumption is much lower under the lockdown. Clothing and footwear is available online, but expenditure is again low. These items are lower in absolute terms and, more importantly, as a share of expenditure.
The price of petrol has fallen considerably in recent months and is now selling at about £1 per litre. Indeed, the Bank of England has identified energy as a key factor in keeping inflation low: ‘CPI inflation declined to 1.5% in March and is likely to fall below 1% in the next few months, in large part reflecting developments in energy prices’ (Monetary Policy Report, May 2020). Thus, even though very little is being spent on petrol during the lockdown, the ONS methodology means it has an effect on the price index that is even bigger than usual due to its being used to impute the unavailable prices.
The items in clothing and footwear are also present. Although available, one would expect that that the prices of items in clothing and footwear to fall in response to the fall in demand. Indeed, the April figure for inflation in clothing and footwear was -2.8%. Again, although expenditure on clothing and footwear is low, it will have the full effect on inflation implied by its usual expenditure share boosted again by imputation.
Of course, the lockdown will increase the prices of some items such as food and household items, for which demand has been high during lockdown. The ONS has developed an experimental weekly online price index for High Demand Products (the HDP index) using 22 items including food and household products. In the 8 weeks since the index started (16 March), the HDP index has risen by 1%. This is equivalent to an annualised rate of 6.9% (ONS, 2020b).
Assuming that the equivalent items in the CPIH index behave in a similar way, we can expect this to put upward pressure on the CPIH inflation. The April figure for the inflation of food and non-alcoholic beverages in the CPIH index was 2.6%, up from 1.4% in March. But this upward effect on CPIH inflation would be larger if the expenditure share was increased to reflect the changes in expenditure patterns during the lockdown.
Is the imputation method adopted by the ONS a valid method for dealing with unavailable items?
Economists would say that households are being forced to consume nothing and implicitly, the price of these items is the high ‘choke off’ price at which households would voluntarily choose to consume nothing. If we used these high ‘choke off’ prices for April, then that would imply an increase in inflation.
The ONS methodology prevents this from happening: they explicitly state that their method ‘allows the all-items index calculation to be relatively unaffected by unavailable items’ (ONS, 2020a). In general, price indices are based on actual full transaction prices rather than those implied by economic theory.
While the ONS is tied down by international conventions for its official inflation statistics, its proposed methodology will lead to an inflation measurement that is too low in the coming months. To keep track of inflation during the pandemic, an experimental approach is required that allows for shifting expenditure shares. This should be feasible. Many elements of household expenditure are highly predictable and unaffected by the lockdown – rental payments (either actual or imputed), regular payments for home energy, broadband and insurance. Retail data are also available in a timely manner.
A ‘lockdown-weighted’ inflation measure
The weekly HDP index is a step in the right direction, but the ONS should extend it to allow for a CPIH-wide experimental index to capture the full effect of the lockdown on inflation. Like the ‘lockdown-weighted’ inflation measure, CPILW, it could be published alongside the ‘official’ measure.
Figure 1 compares the path of CPIH and CPILW over the period January 2020 to April 2020. In the first three months, January to March, priority goes to CPIH as the most accurate measure. But in April, the CPIH underestimates actual inflation: the lockdown weights are possibly more appropriate and indicate inflation of 1.2%. Nevertheless, the fall in inflation of 0.6% is exactly the same for both measures.
Figure 1: CPIH and CPILW
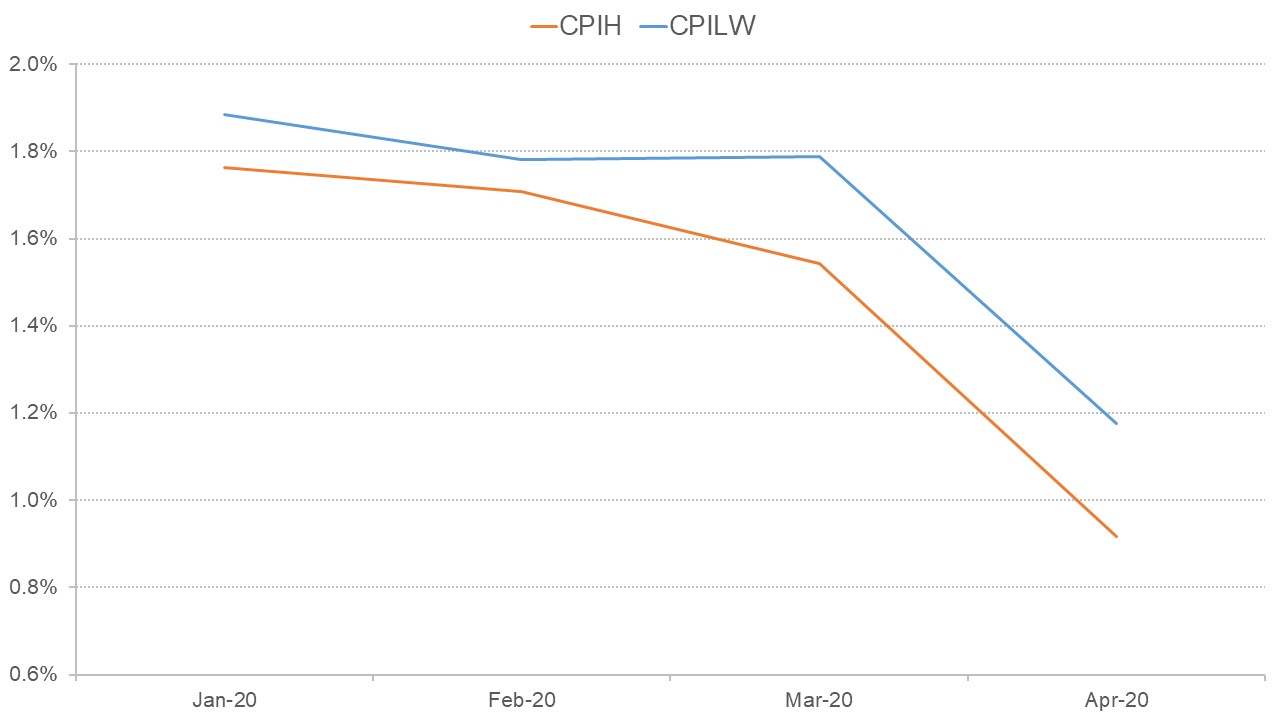
Source: ONS, NIESR
While the impact of changing expenditure shares can be taken into account, as in CPILW, at a more fundamental level, the impact of the shift to 100% collection of prices online or by phone is harder to predict and will emerge only as we see the data. Will there be enough price quotes available? Will the products and services whose prices can be collected online be similar enough to the ones collected offline in March?
Since the annual headline inflation figure is supposed to compare like-with-like prices over a 12-month period, this may prove more problematic than the shifts in expenditure shares. Overall, the lockdown and fear of Covid-19 have led to big changes in consumer behaviour and expenditure patterns, which are likely to persist for some time. These pose big challenges for the measurement of inflation and its consistency with data before and after the lockdown.
While the official measure CPIH may not be able to deal with these changes adequately, there is a need to experiment with new approaches that can better cope with these challenges and measure inflation better during the lockdown and its aftermath. There are existing methodologies for dealing with rapidly changing expenditure shares (Bhardwaj et al, 2017): perhaps necessity will be the mother of invention and these will be adopted for the official CPIH statistic as a result of the pandemic.
Where can I find out more?
Inflation: History and Measurement: A book by Robert O’Neill, Jeff Ralph and Paul Smith, Palgrave Macmillan (2017).
Research indices using web scraped price data: Himanshi Bhardwaj, Tanya Flower, Philip Lee and Matthew Mayhew summarise research in progress into using web scraped price data in the production and development of consumer price statistics.
The measurement of inflation during the lockdown: a trial calculation: Huw Dixon’s analysis for NIESR and an accompanying blog – Will CPIH inflation understate inflation for April 2020?
Coronavirus and the effect on UK prices: ONS analysis.
Could coronavirus infect the Consumer Price Index?: Richard Blundell and IFS colleagues.
Who are the UK experts on this issue?
- Huw Dixon, Cardiff University
- Peter Levell, Institute for Fiscal Studies